
The above image comes directly from the camera, about 30 minutes more recent than the comparisons below.
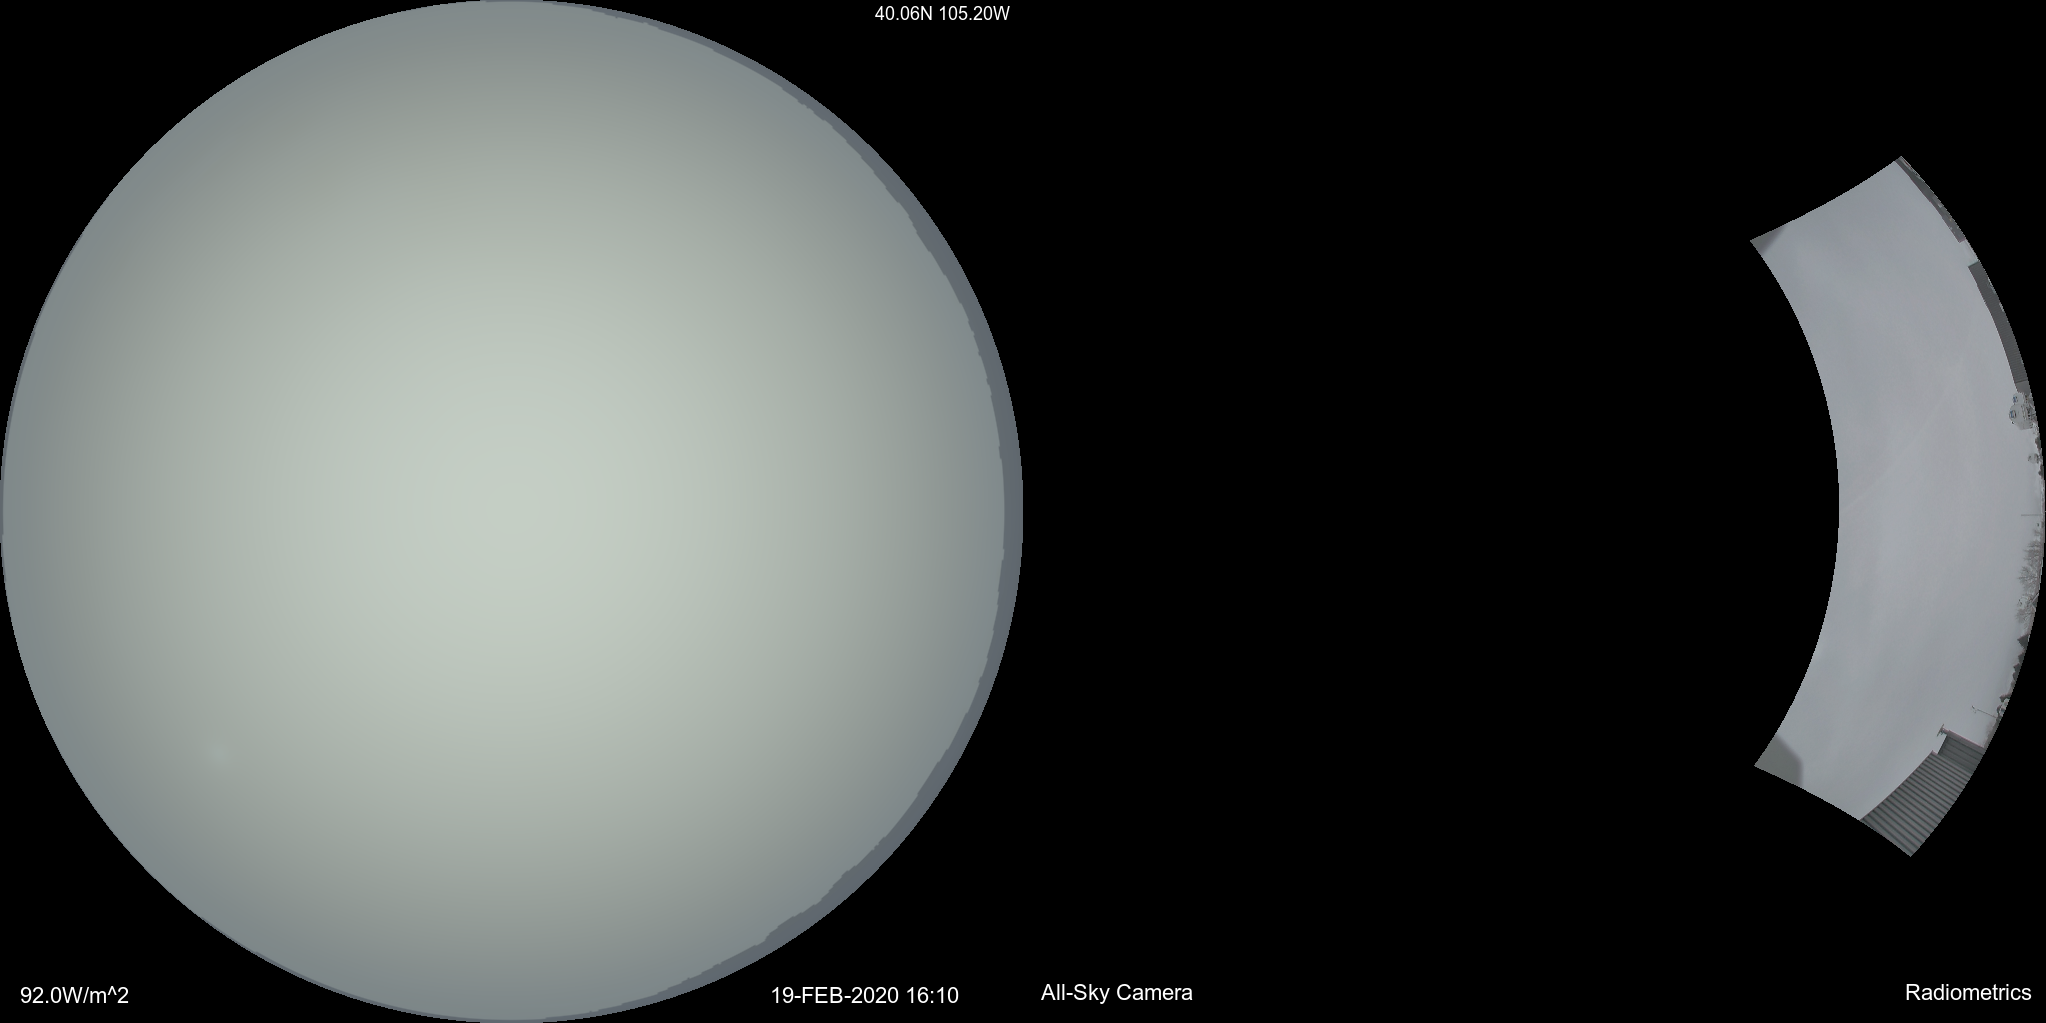
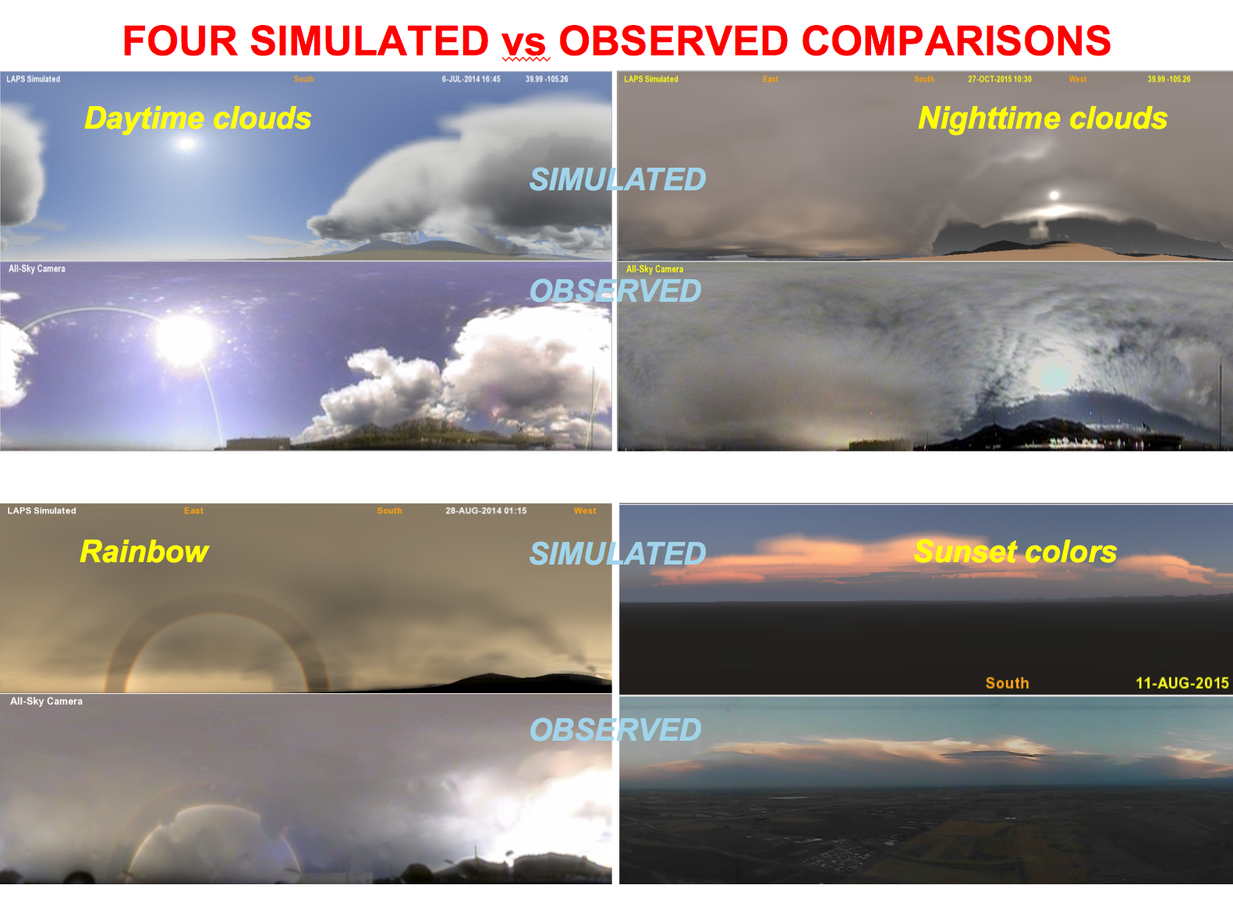
The image above on the left is simulated from the LAPS cloud/aerosol analysis and other data, while the image on the right is from a webcam located at RadioMetrics (just NE of Boulder, CO) at the same time. In each fisheye lens view the zenith is in the center and north is up. The color balance of the simulated image is set to reproduce the "actual" colors/radiances when the display white point is set to closely match the sun. Thus to see a true apples to apples comparison (if for example you take your computer outside or right by a window), please set your display to a color temperature of 5780K (the sun's white color above the atmosphere). Some images are shown a bit dark to avoid saturating and losing details on the bright end. This can be compensated for by turning up your monitor brightness, thus showing a broader dynamic range.
Latest all-sky comparison image | mask (site is RadioMetrics)
Latest comparison animations (site is RadioMetrics): Polar | Cylindrical
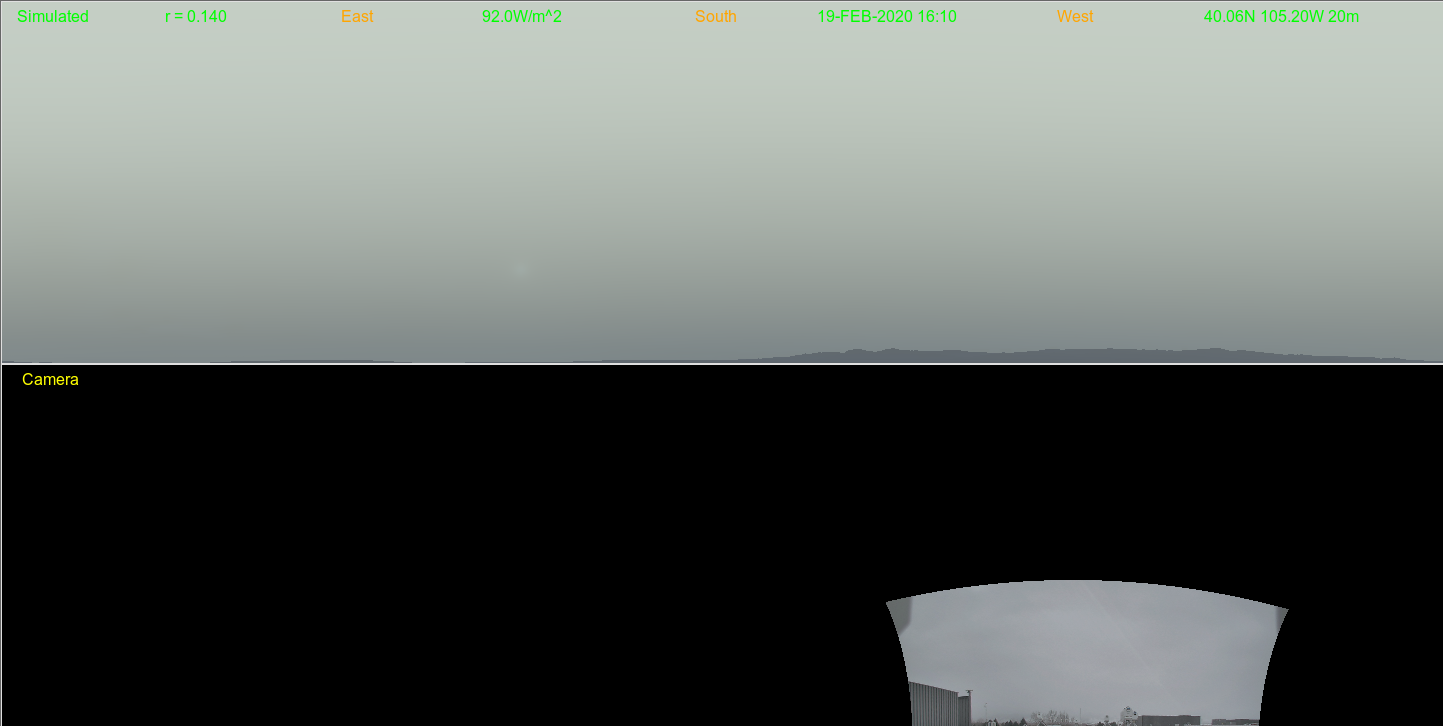 In these 360 degree panoramic (all-sky) views, a simulated LAPS image is shown (top) compared with a remapped camera image (middle)
from an all-sky camera maintained by RadioMetrics.
South is at the center of each image and north is at the edges.
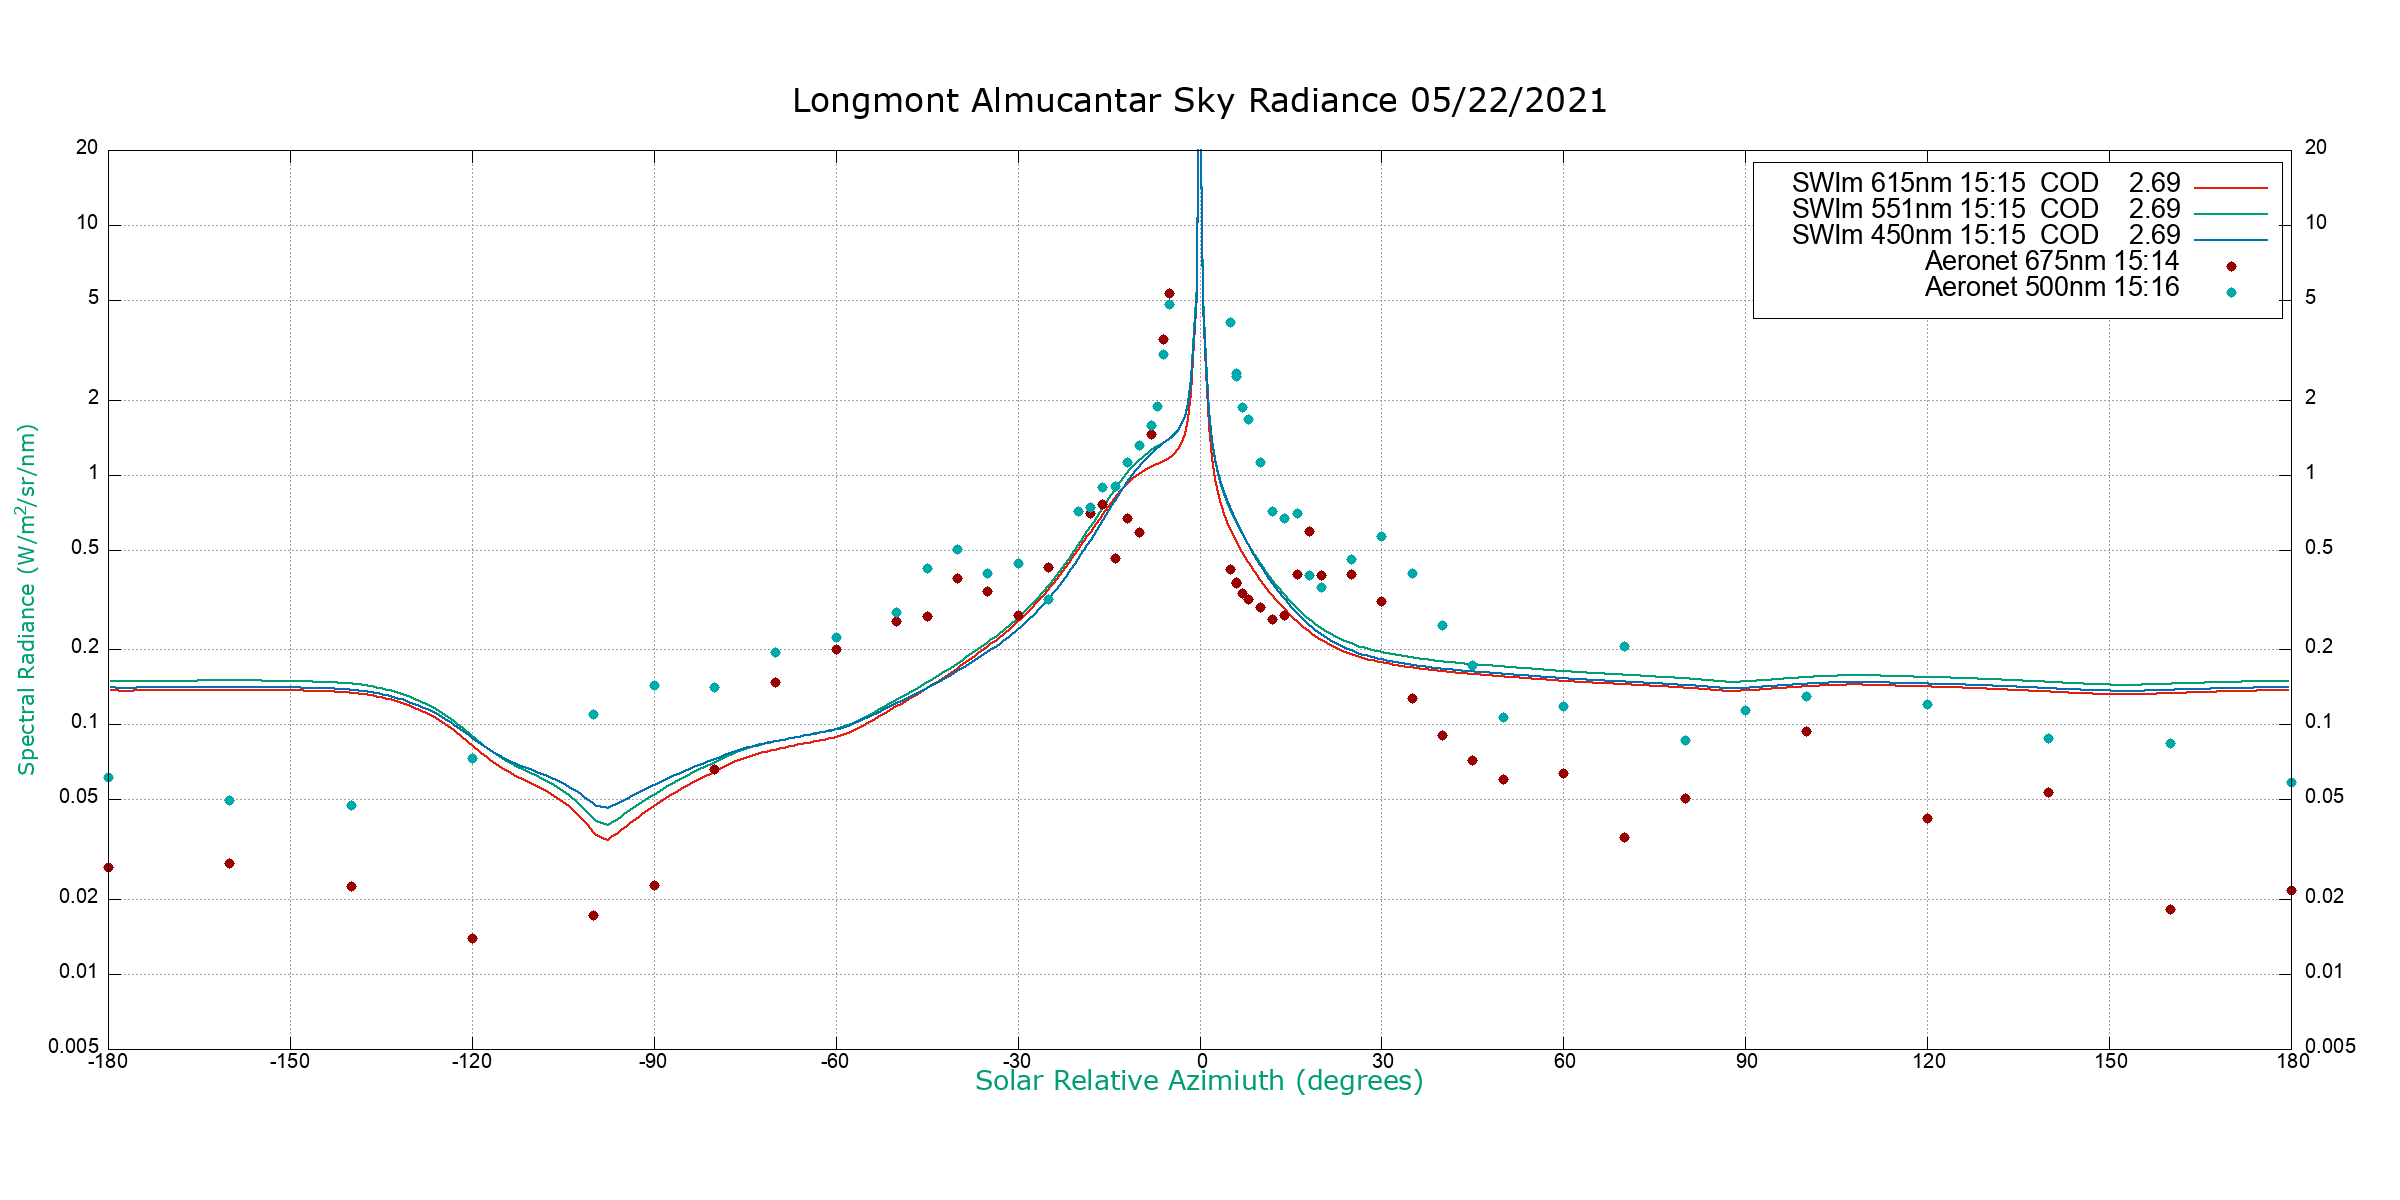
The listed solar irradiance is calculated from the same radiance information used to construct the image.
In these 360 degree panoramic (all-sky) views, a simulated LAPS image is shown (top) compared with a remapped camera image (middle)
from an all-sky camera maintained by RadioMetrics.
South is at the center of each image and north is at the edges.
The listed solar irradiance is calculated from the same radiance information used to construct the image.
Archive Directories (site is RadioMetrics): Polar Comparison | Polar Blinking | Cylindrical Comparison | Polar Camera | Cylindrical Camera | Raw Camera
Other Related Endeavors from around the web
More visualizations are on my main home page | Contact: Steve Albers (Steven.Albers@colostate.edu)