
The image above on the left is simulated from an analysis of 3D hydrometeors using GOES ABI and other data. Aerosols are specified via namelist. The image on the right is from an EKO Instruments all-sky camera located at CIRA (at Colorado State University in Fort Collins) at the same time. In each fisheye lens view the zenith is in the center and north is up. The color balance of the simulated image is set to reproduce the "actual" colors/radiances when the display white point is set to closely match the sun. Thus to see a true apples to apples comparison (if for example you take your computer outside or right by a window), please set your display to a color temperature of 5780K (the sun's white color above the atmosphere). Some images are shown a bit dark to avoid saturating and losing details on the bright end. This can be compensated for by turning up your monitor brightness, thus showing a broader dynamic range.
Latest all-sky comparison image | mask (site is CIRA)
Latest comparison animations (site is CIRA): Polar | Cylindrical
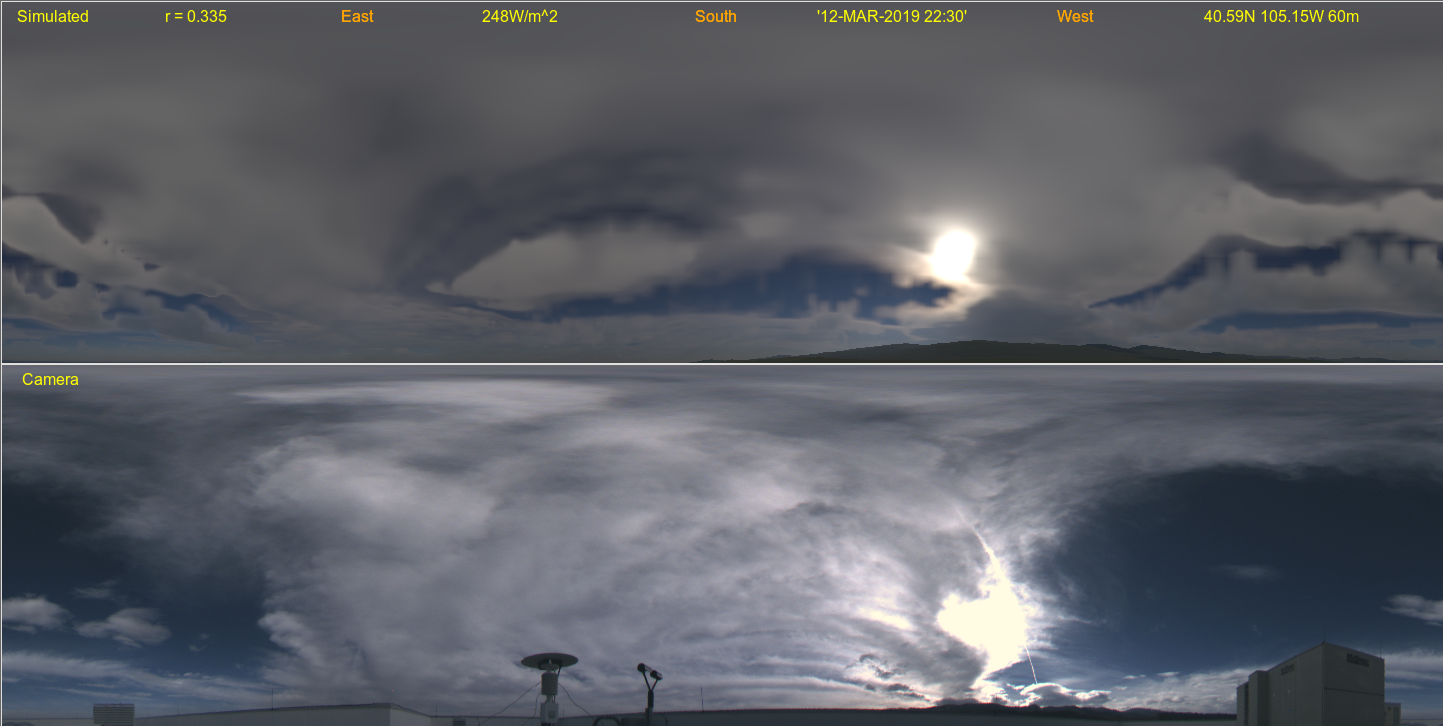
 In these 360 degree panoramic (all-sky) views, a simulated LAPS image is shown (top) compared with a remapped camera image (middle)
from an EKO all-sky camera installed at CIRA.
The bottom image is the ratio between the two (camera / simulated).
South is at the center of each image and north is at the edges.
The listed solar irradiance is calculated from the same radiance information used to construct the image.
In these 360 degree panoramic (all-sky) views, a simulated LAPS image is shown (top) compared with a remapped camera image (middle)
from an EKO all-sky camera installed at CIRA.
The bottom image is the ratio between the two (camera / simulated).
South is at the center of each image and north is at the edges.
The listed solar irradiance is calculated from the same radiance information used to construct the image.
Archive Directories (site is CIRA): Raw Camera | Polar Camera | Cylindrical Camera | Polar Comparison | Polar Blinking | Cylindrical Comparison
Other Related Endeavors from around the web
More visualizations are on my main home page | Contact: Steve Albers (Steven.Albers@colostate.edu)