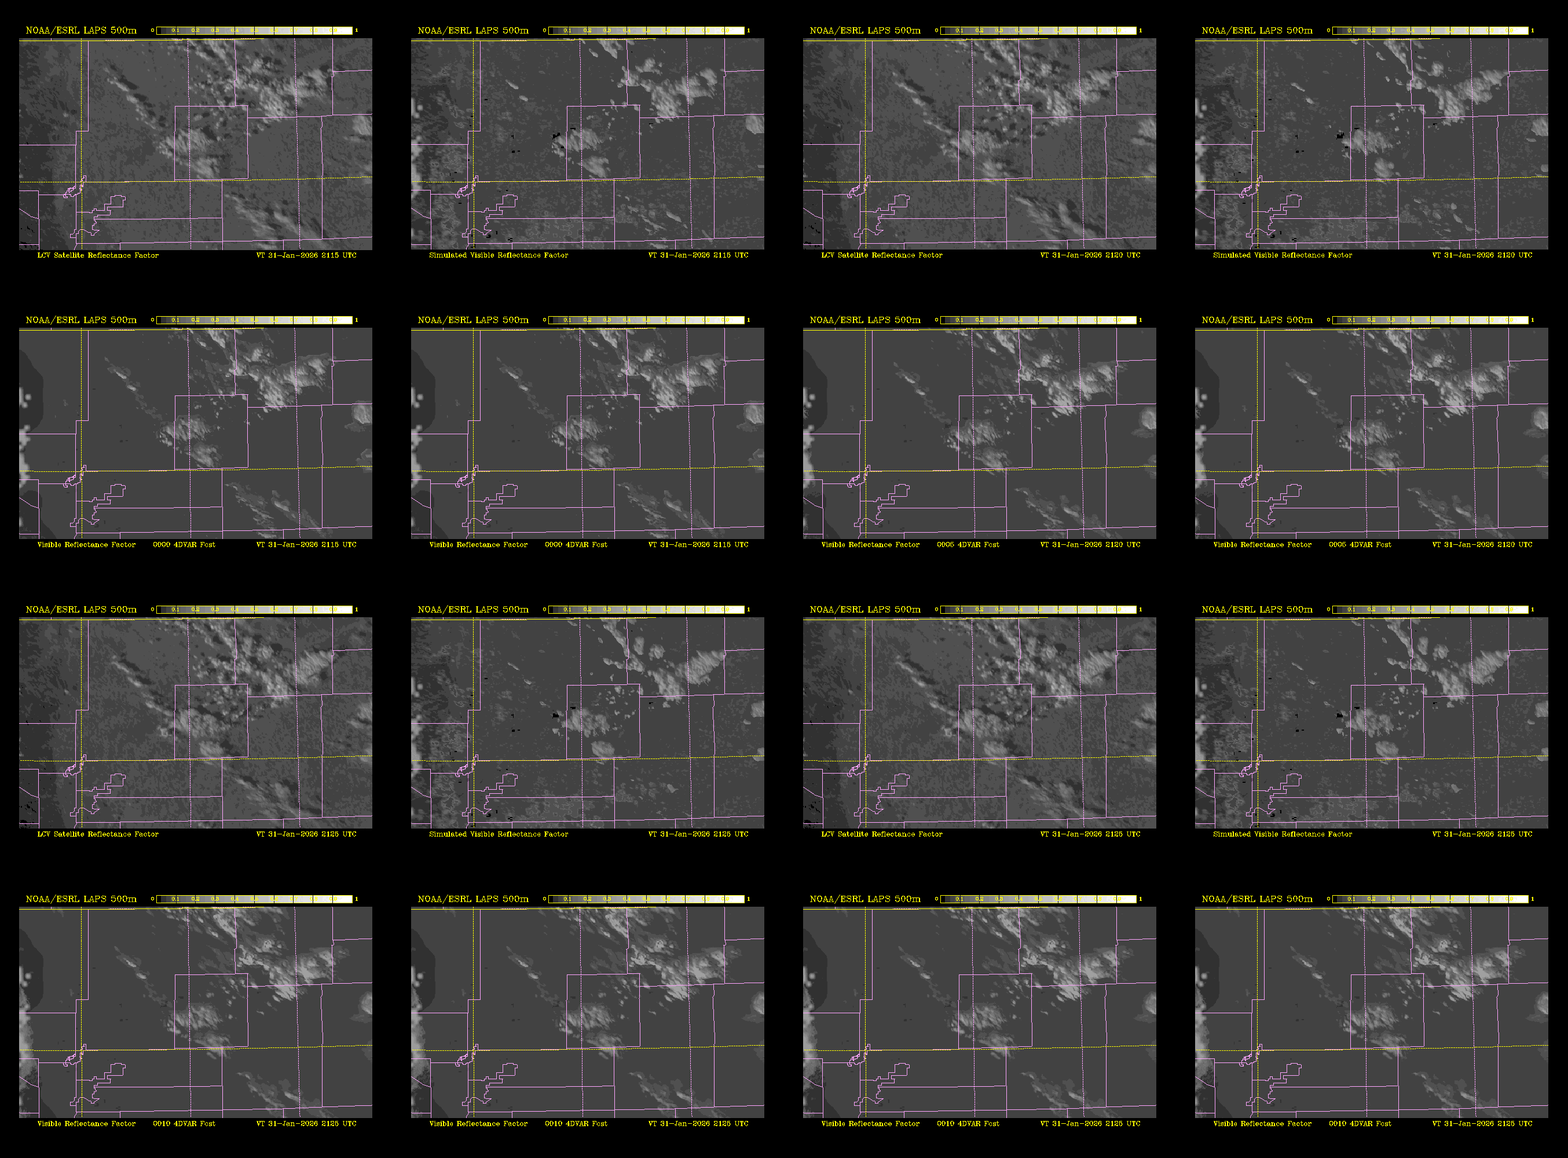
A preliminary result is shown above for a 4D-Var cloud analysis with observed visible "VIS" satellite (upper left), simulated VIS from regular LAPS cloud analysis (upper right), and 4D-Var cloud analysis fitted with an observation window from 2115 UTC to 2120 UTC (bottom). Both bottom panels are the same data. A subsequent 4D-Var forecast continues at 2125 UTC. Thus the 4D-Var model sequence is constrained by the data at 0000 and 0005 minutes, and extending as a free forecast for 5 minutes to the ending time of 0010 minutes. The adjoint is set up using automatic differentiation of a simple forecast model. Radiative transfer thus far is 1-D for these 4D-Var experiments.
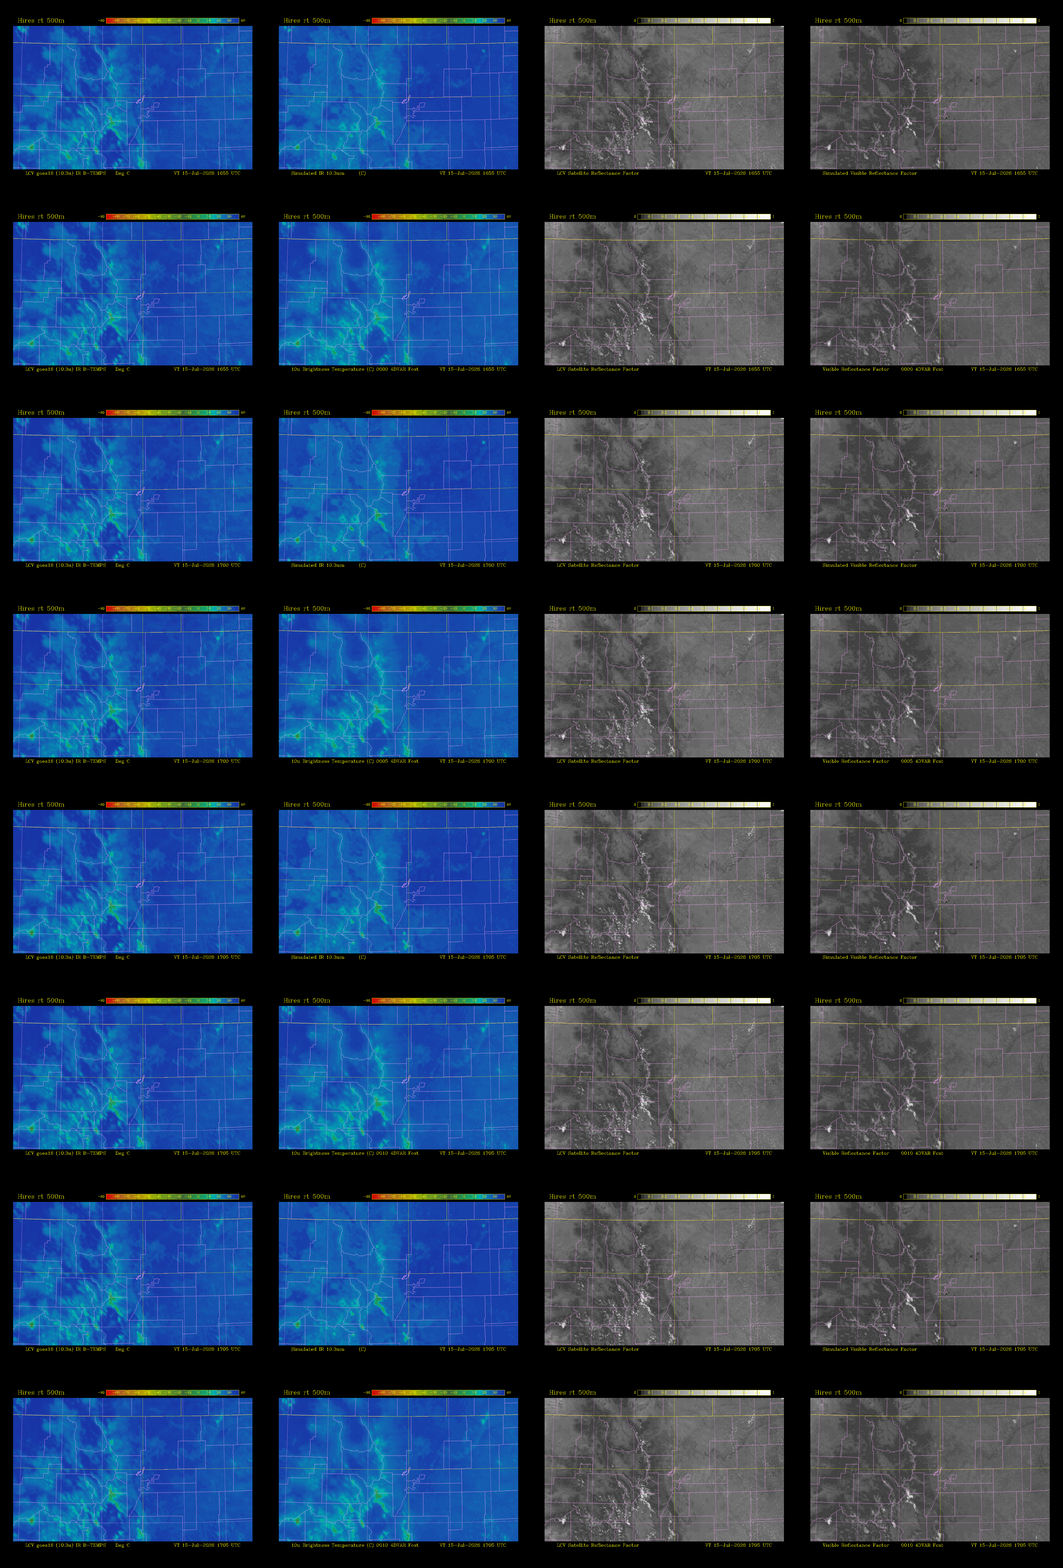
An enhanced version now incorporates VIS satellite, IR satellite (10 micron clean window channel from GOES-ABI) along with NEXRAD radar data (VIS/IR animated above).
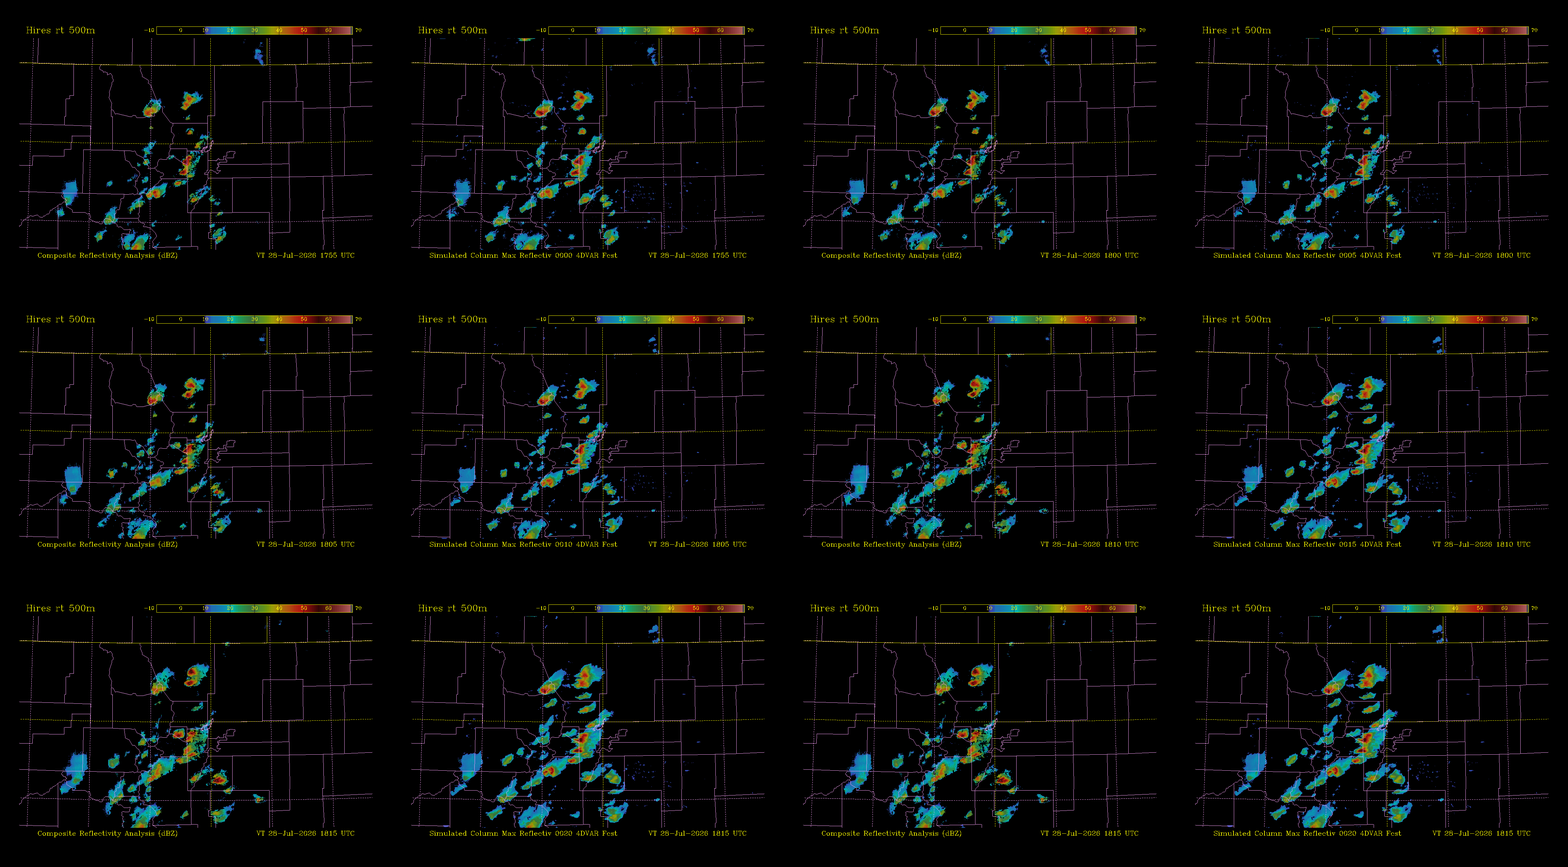
NEXRAD Radar Reflectivity is now included with the VIS/IR satellite. This result shows composite reflectiviy with growing storm anvils over time.
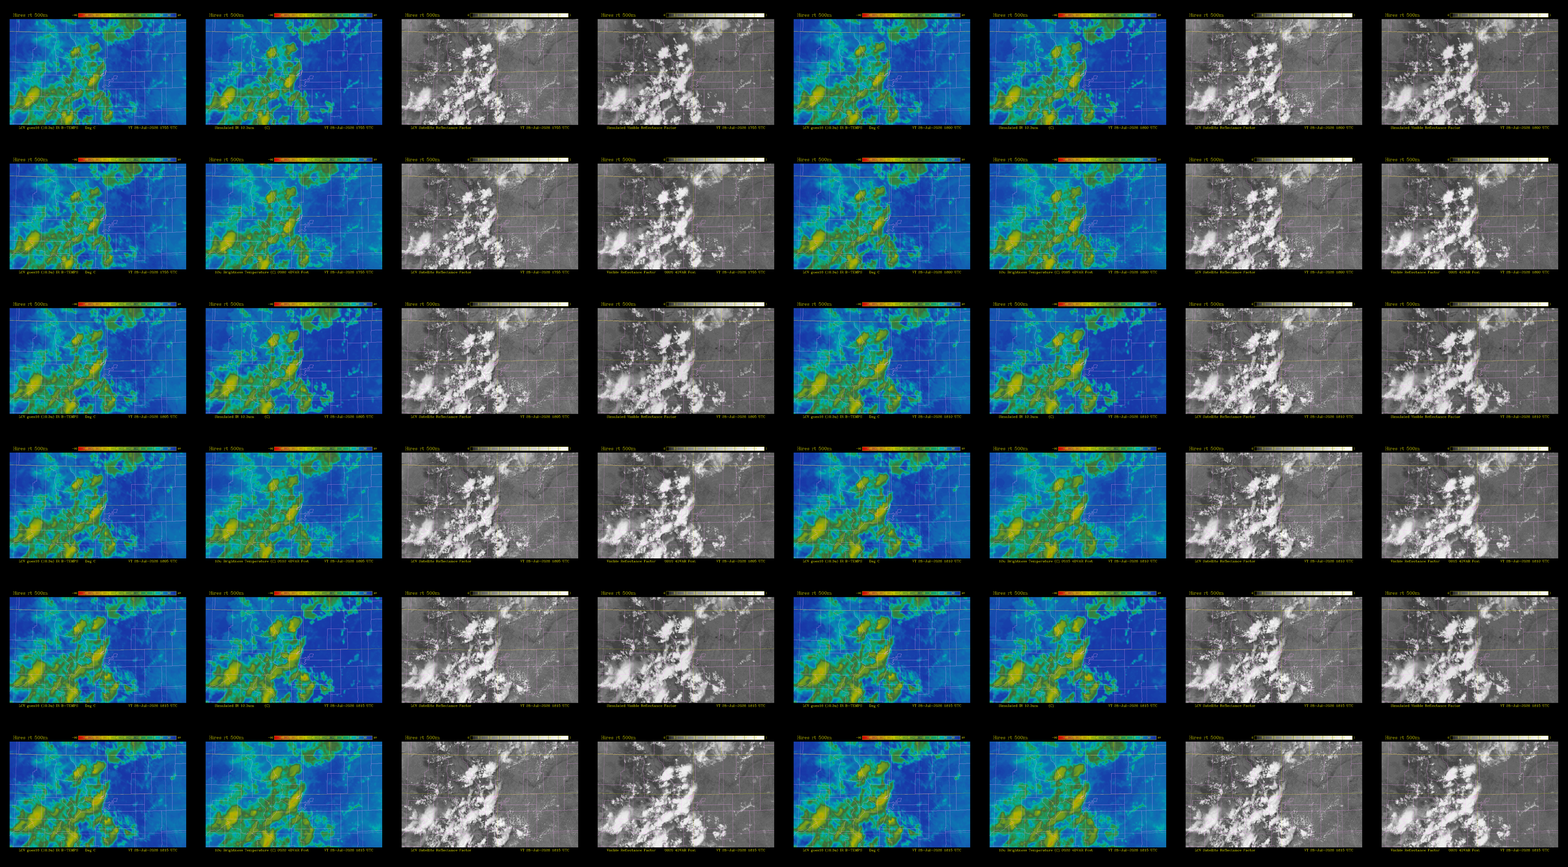
Here is VIS and IR for this July 28 case that has more convection in it. A simple dynamic evolution of storms is happening beyond pure advection that will be an area of further testing within the 4D-Var framework. The assimilation window is between 0-5 minutes from the reference time and the free forecast runs from the 5-minute to 20-minute mark.
Observations from ground-based cameras located in Colorado are being used via SWIm to validate the 4D-Var assimilation, including a case featuring wave clouds in Boulder County. At even higher resolutions observations from other ground based cameras, also described in this paper, can potentially used along with satellites, and radars in the assimilation process.
It may also be possible to variationally constrain clouds by looking at multiply scattered light from different vantage points. Since the light scatters throughout the interior of the clouds, the observed radiance provides information on the cloud optical and microphysical charasterics, such as optical thickness and liquid water content. A video explaining these concepts can be found on YouTube or in MP4 format (courtesy Israel Institute of Technology). A python software package performing this type of tomographic analysis (3-D radiative transfer) based on SHDOM can be found here, described in this research article using airborne cameras. Here is a neural network version of the tomographic 3-D cloud retrieval. This related satellite data assimilation discussion helps to summarize things.
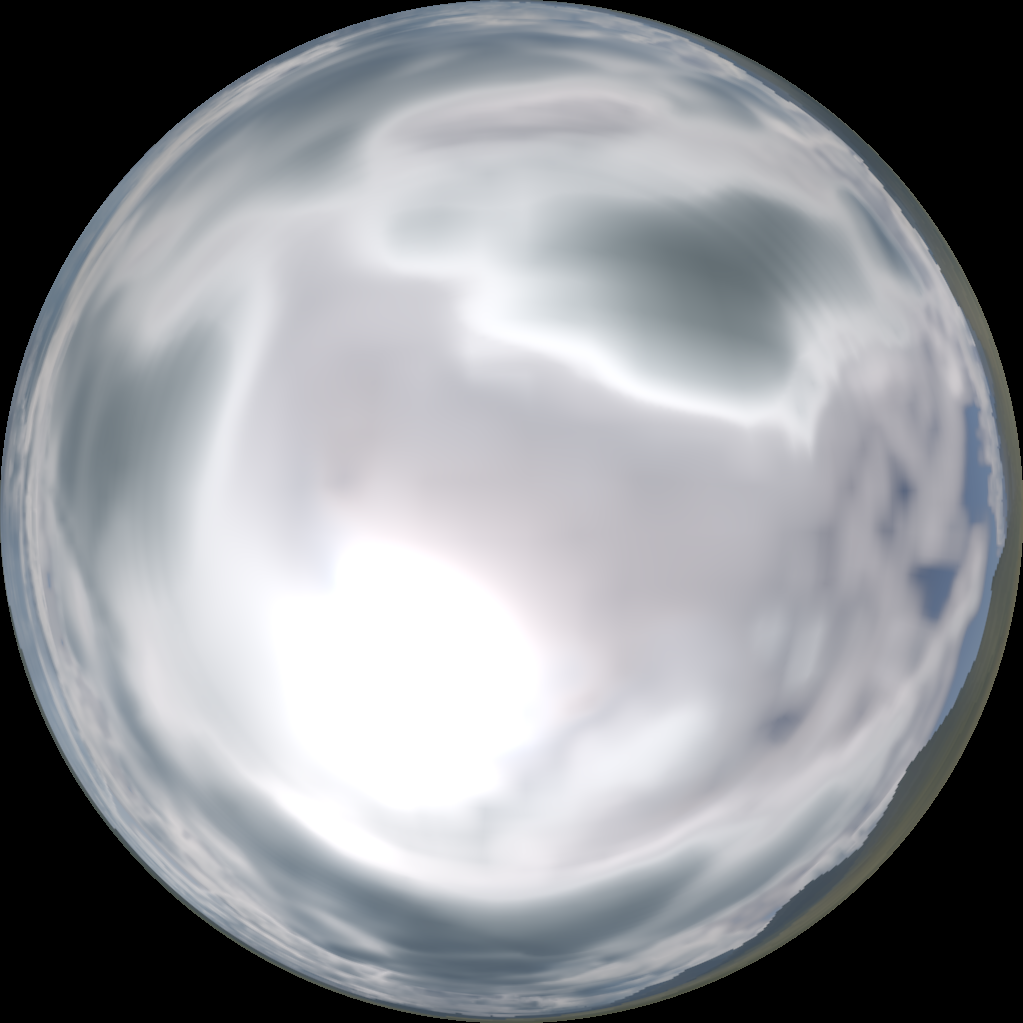
Original SWIm Sky Simulation 500m resolution Cloud Analysis |
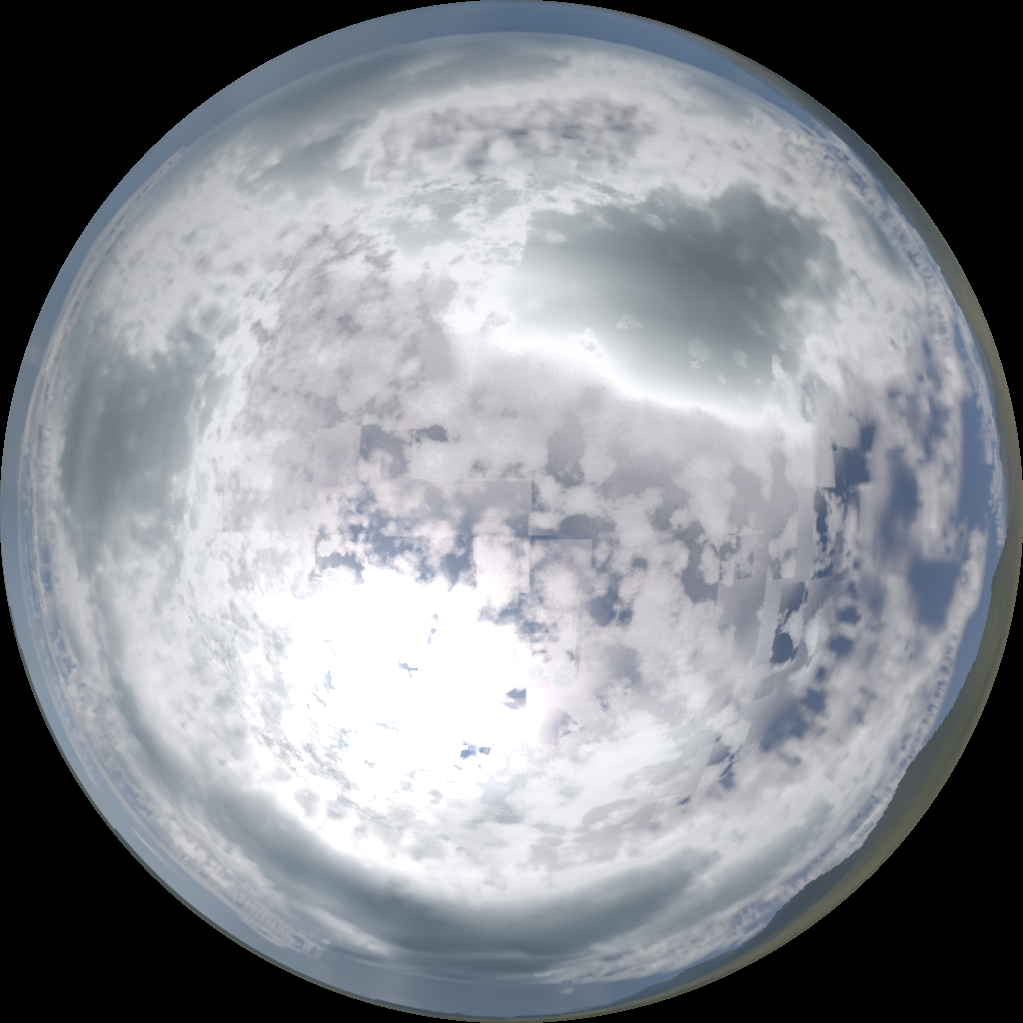
Enhanced SWIm Simulation Clouds downscaled to 12.5m resolution |
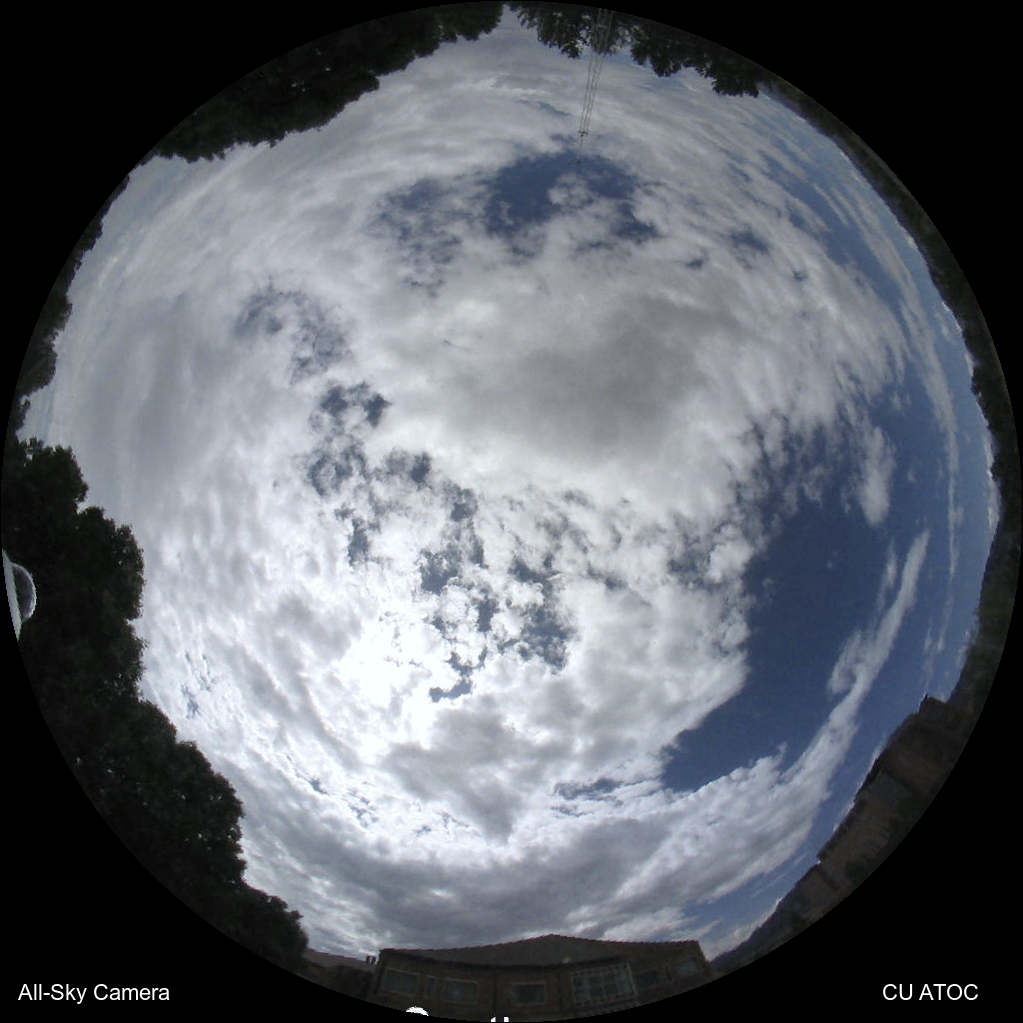
All-Sky Camera Reference University of Colorado, Boulder |
At even higher resolutions observations from ground based cameras, also described in this paper, can be used along with satellites, and radars to variationally constrain clouds by looking at multiply scattered light from different vantage points. Since the light scatters throughout the interior of the clouds, the observed radiance provides information on the cloud optical and microphysical charasterics, such as optical thickness and liquid water content. A video explaining these concepts can be found on YouTube or in MP4 format (courtesy Israel Institute of Technology). A python software package performing this type of tomographic analysis (3-D radiative transfer) based on SHDOM can be found here, described in this research article using airborne cameras. Here is a neural network version of the tomographic 3-D cloud retrieval. This related satellite data assimilation discussion helps to summarize things.
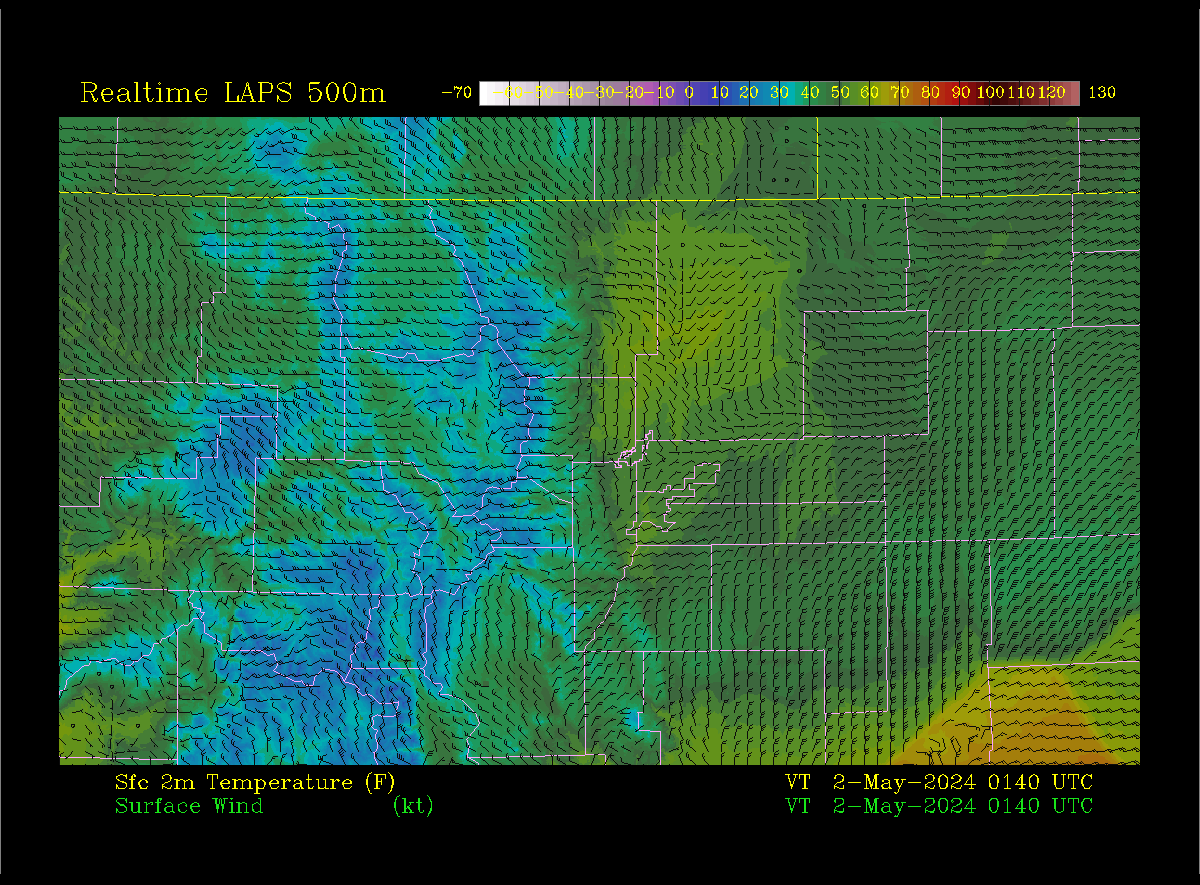
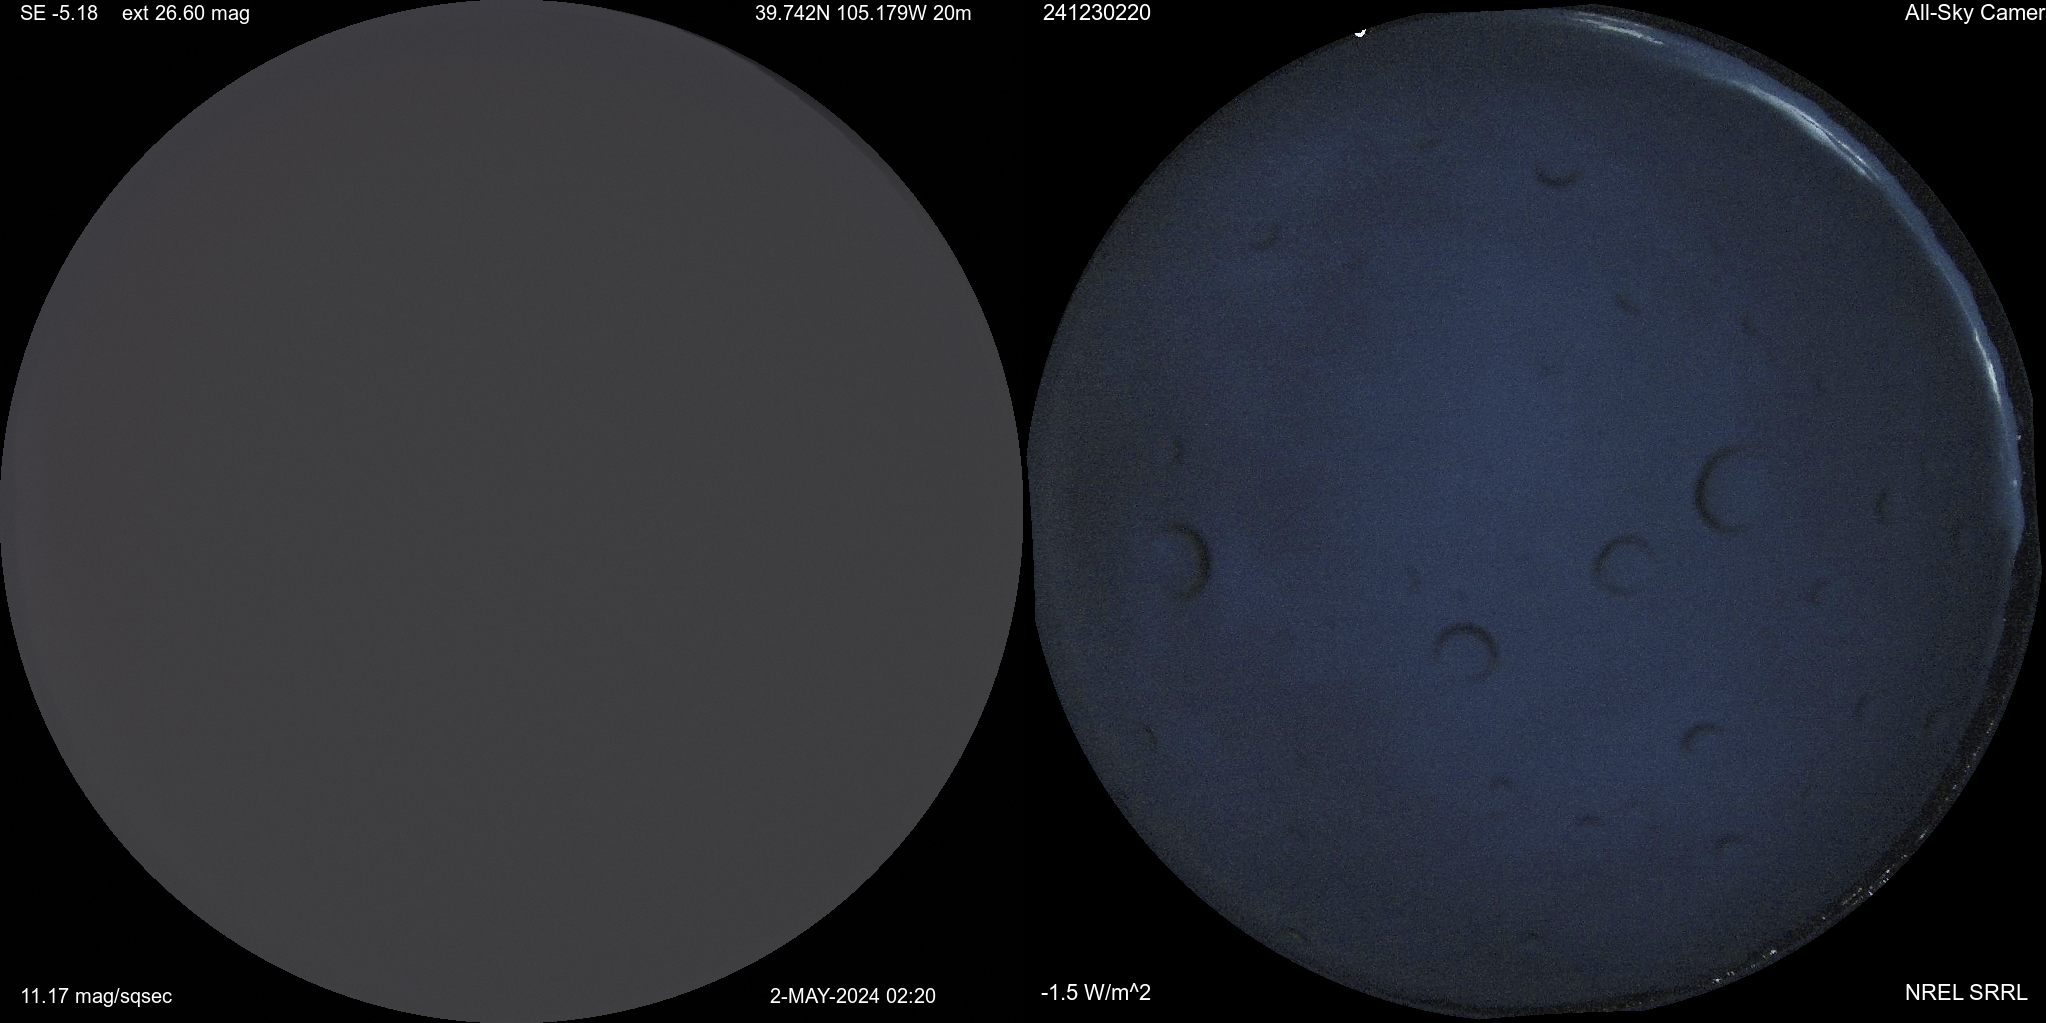
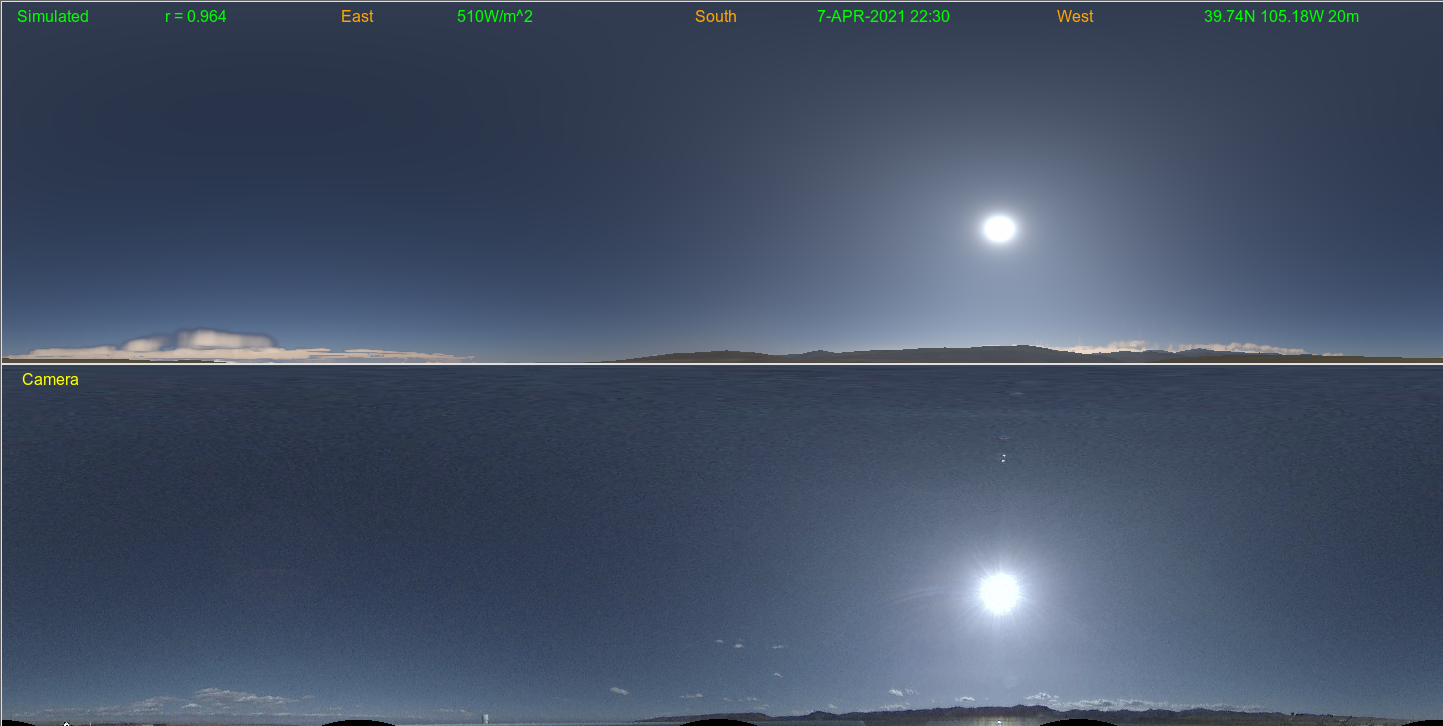
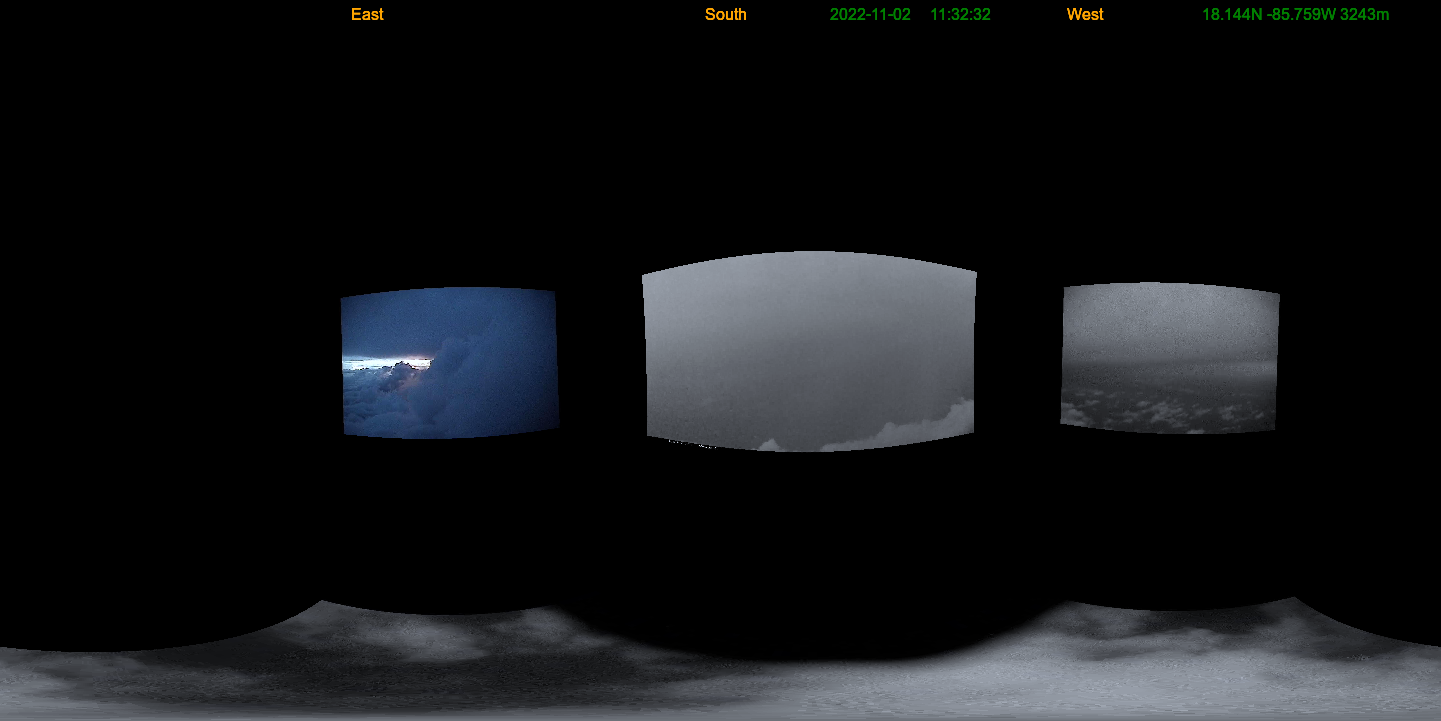
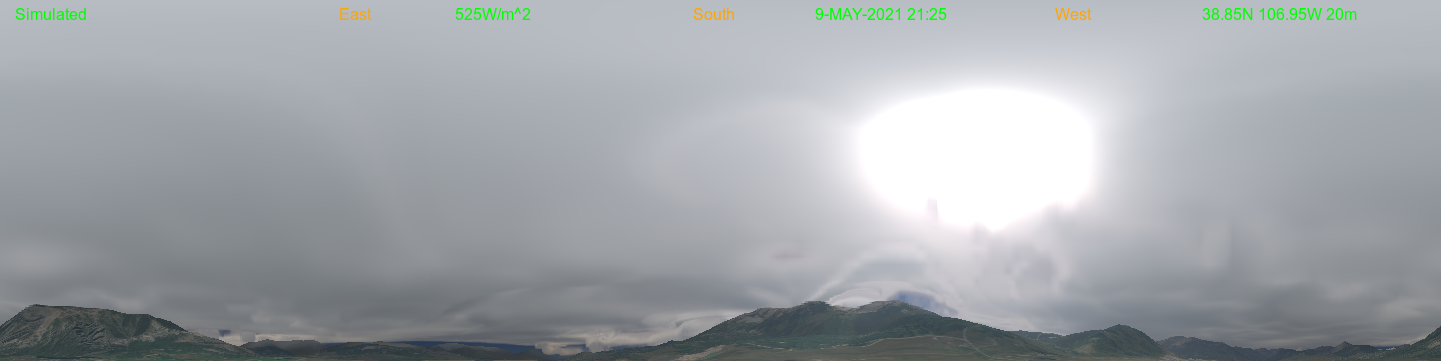
The Simulated Weather Imagery (SWIm) package can be run to yield interesting (often remarkably close) comparisons between these analyses and simultaneous ground-based all-sky camera images. Both the cloud analysis and SWIm package are housed in the LAPS software distribution, though are modular enough to be used in other modeling systems.