Live Simulated All-Sky Camera Images with Clouds and Aerosols |
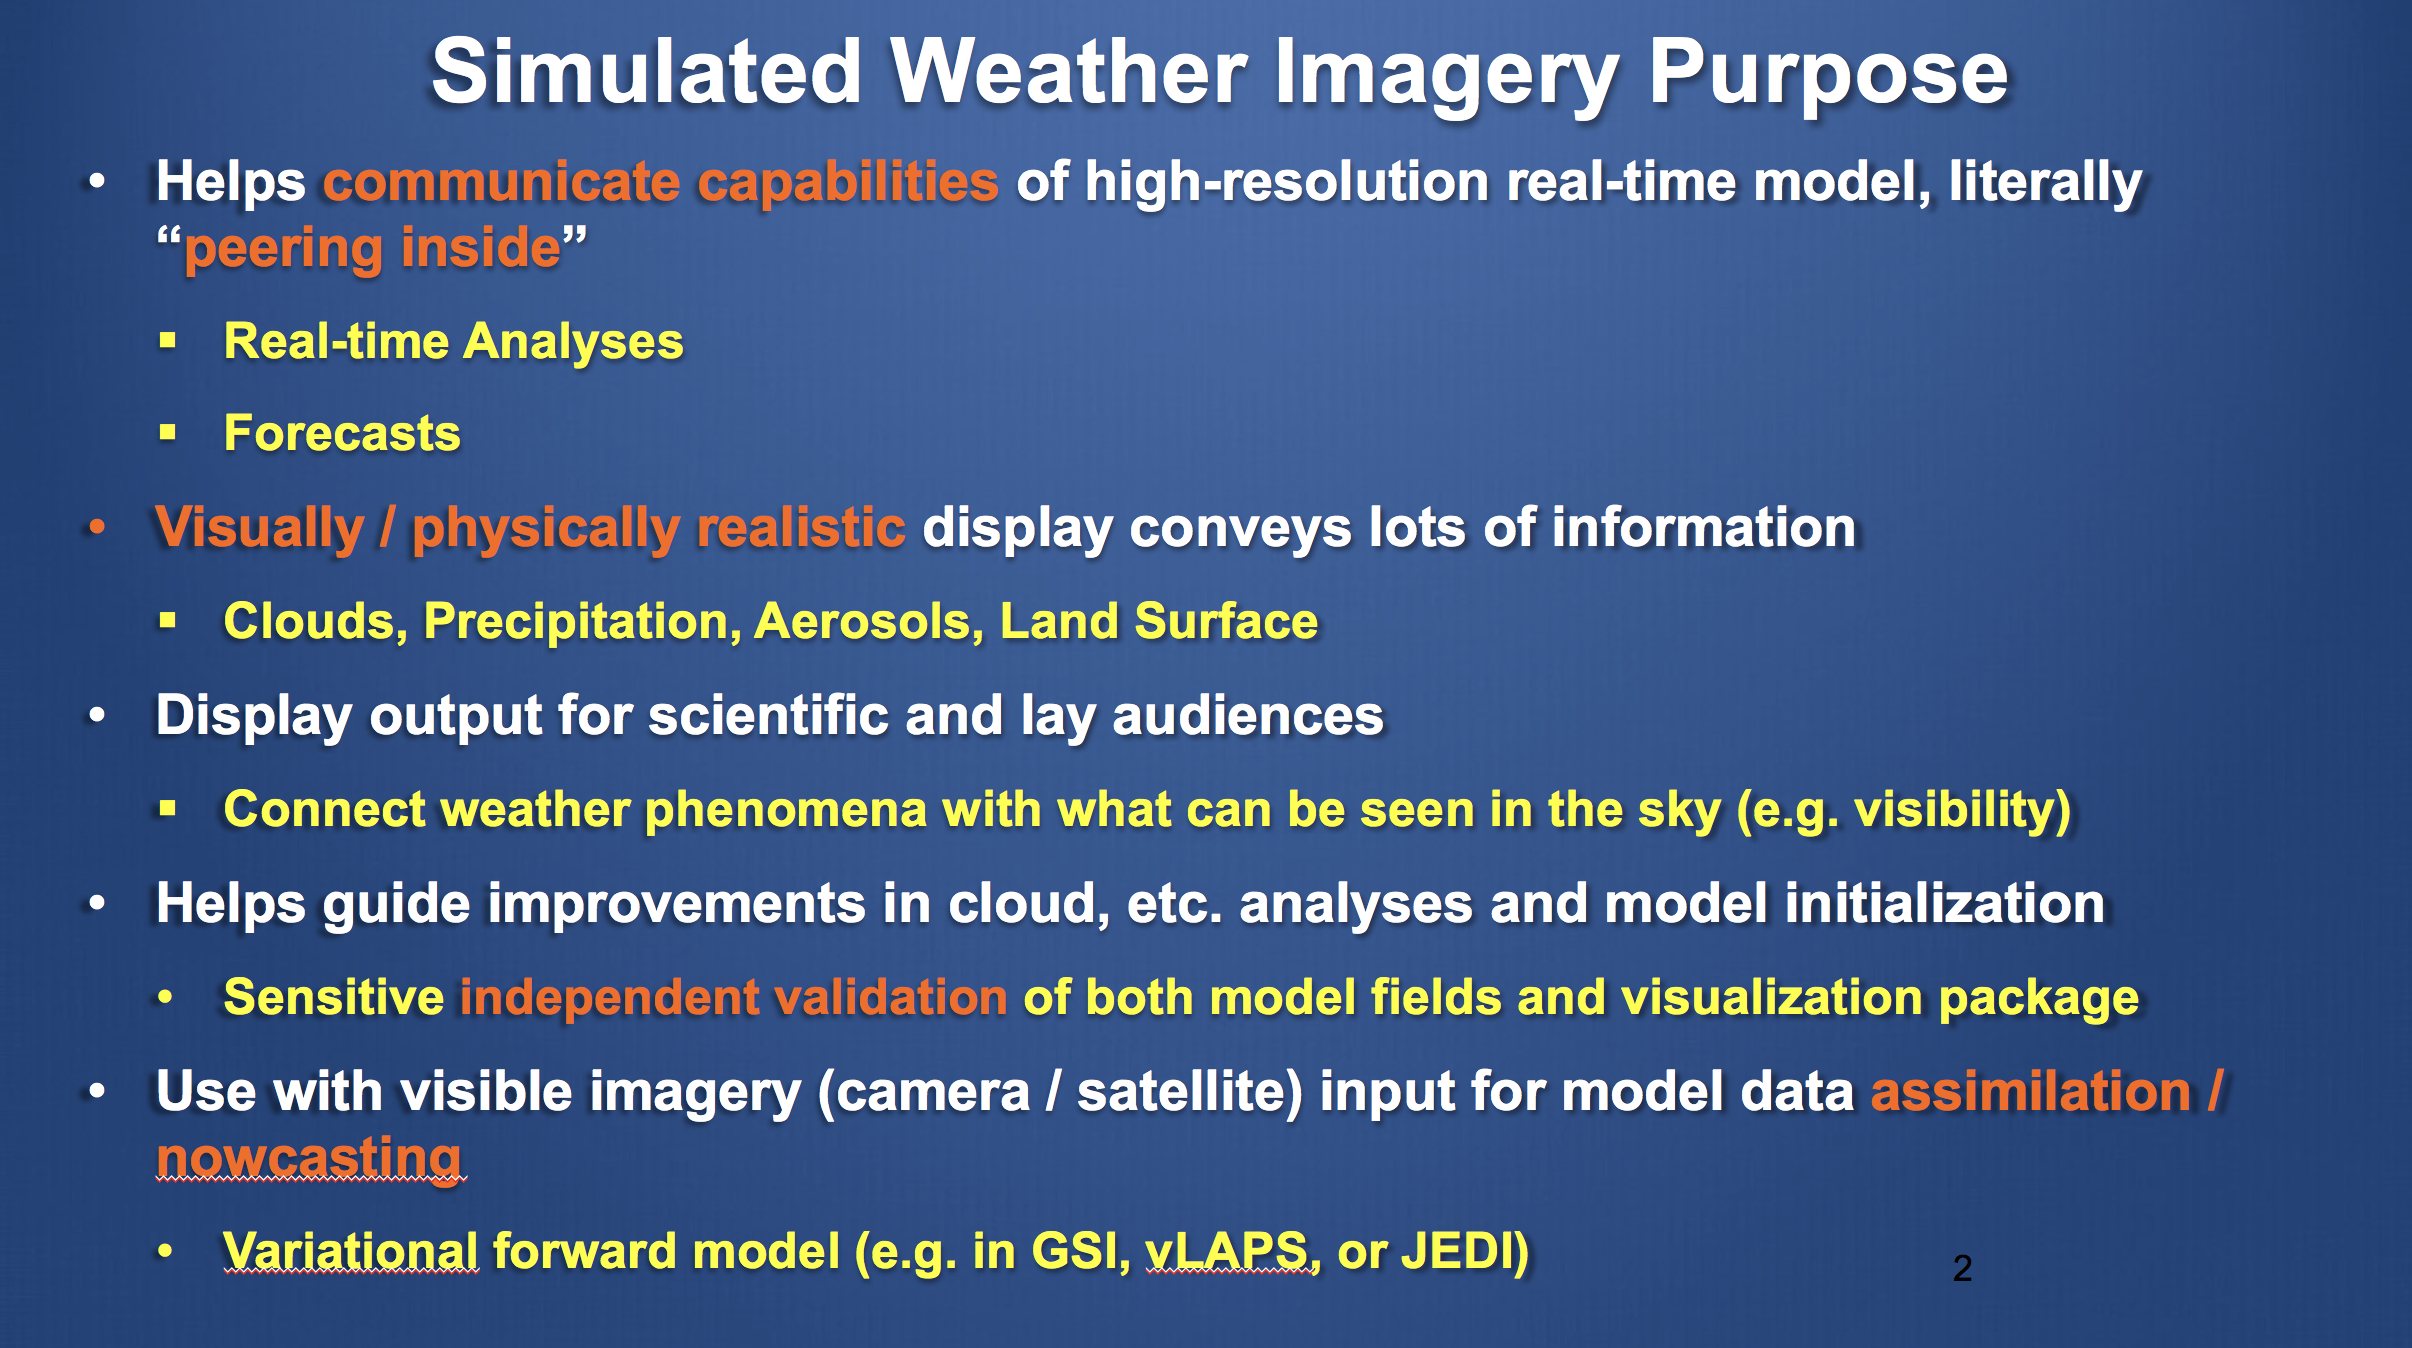
Purpose
|
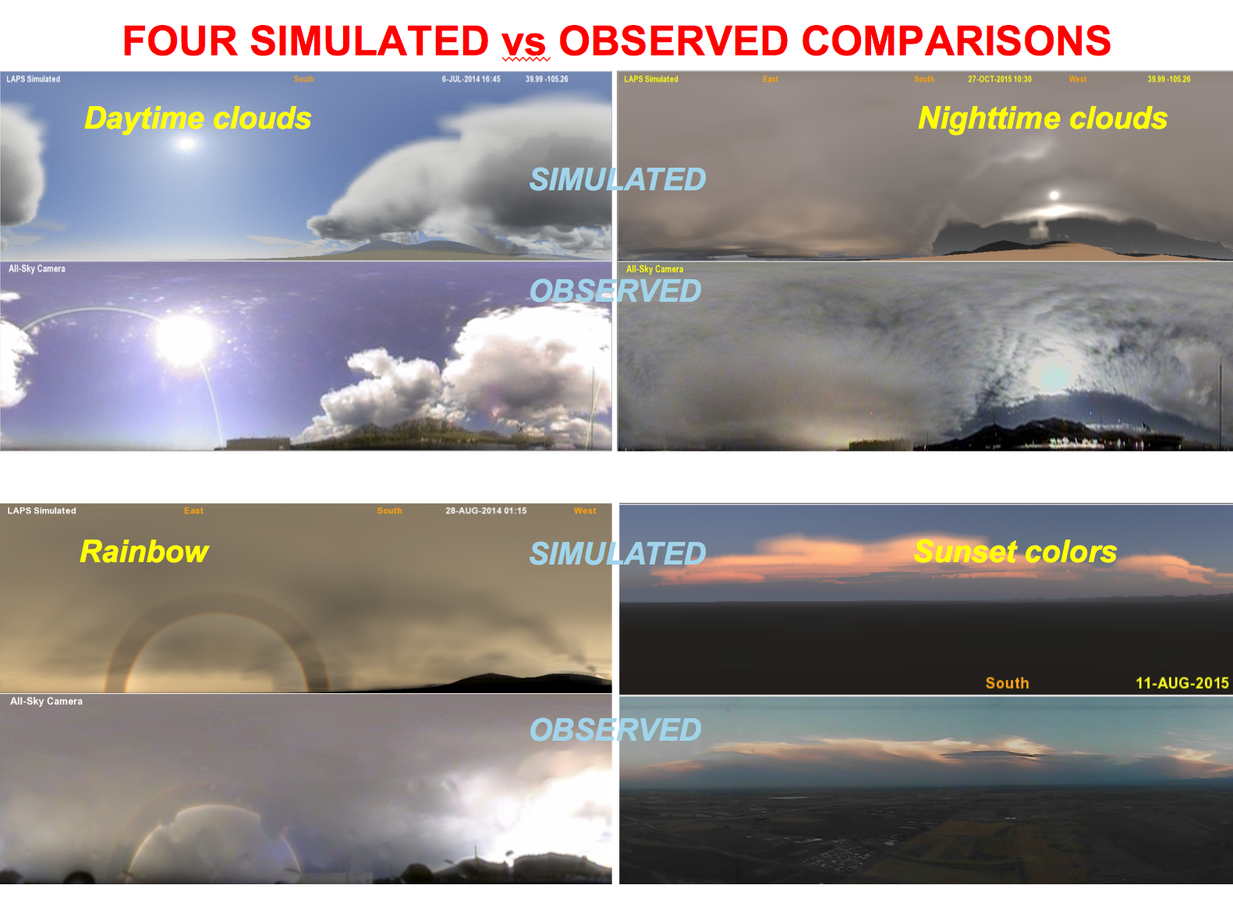
Gallery
|
Cases
Real-time visually and physically realistic sky (cloud and land) simulations are being produced from current weather data,
analyzed to produce 3-D hydrometeor/aerosol fields using an enhanced version of the
Local Analysis and Prediction System (E-LAPS).
This is running over a
Colorado 500 meter resolution domain.
The analysis uses geostationary satellite (including IR and 500m resolution visible imagery, updated every 5 minutes), METARs, radar, aircraft, PM2.5, and model first
guess information to produce 3-D fields of cloud liquid, cloud ice, rain, snow, and aerosol extinction. Several land surface fields are also produced.
The 500m grid resolution takes advantage of the 500m satellite resolution in the visible wavelengths.
The gridded fields are converted using a fast 3D radiative transfer (ray-tracing) technique into an all-sky image.
Details on the techniques behind these simulations can be found in this
journal article
along with this
powerpoint presentation.
These visualizations have also been made with analyses of present weather from E-LAPS along with forecasts from LAPS, WRF, FIM, CSU/RAMS, NAVGEM, and HRRR.
Preliminary camera assimilation work is being done using cloud mask algorithm output. Other variational assimilation (4DVAR), directly using visible and IR
radiance information (e.g. at a 1-minute cadence) from cameras and satellites in a tomographic fashion
is being proposed for use in various systems.
In 2025 a 3D
downscaling algorithm
was added to create hydrometeor fields in finer grids than the initial cloud analysis (500m daytime / 3km nighttime). The downscaled resolutions
are 50m daytime / 600m nighttime.
Here is a more
detailed description
.
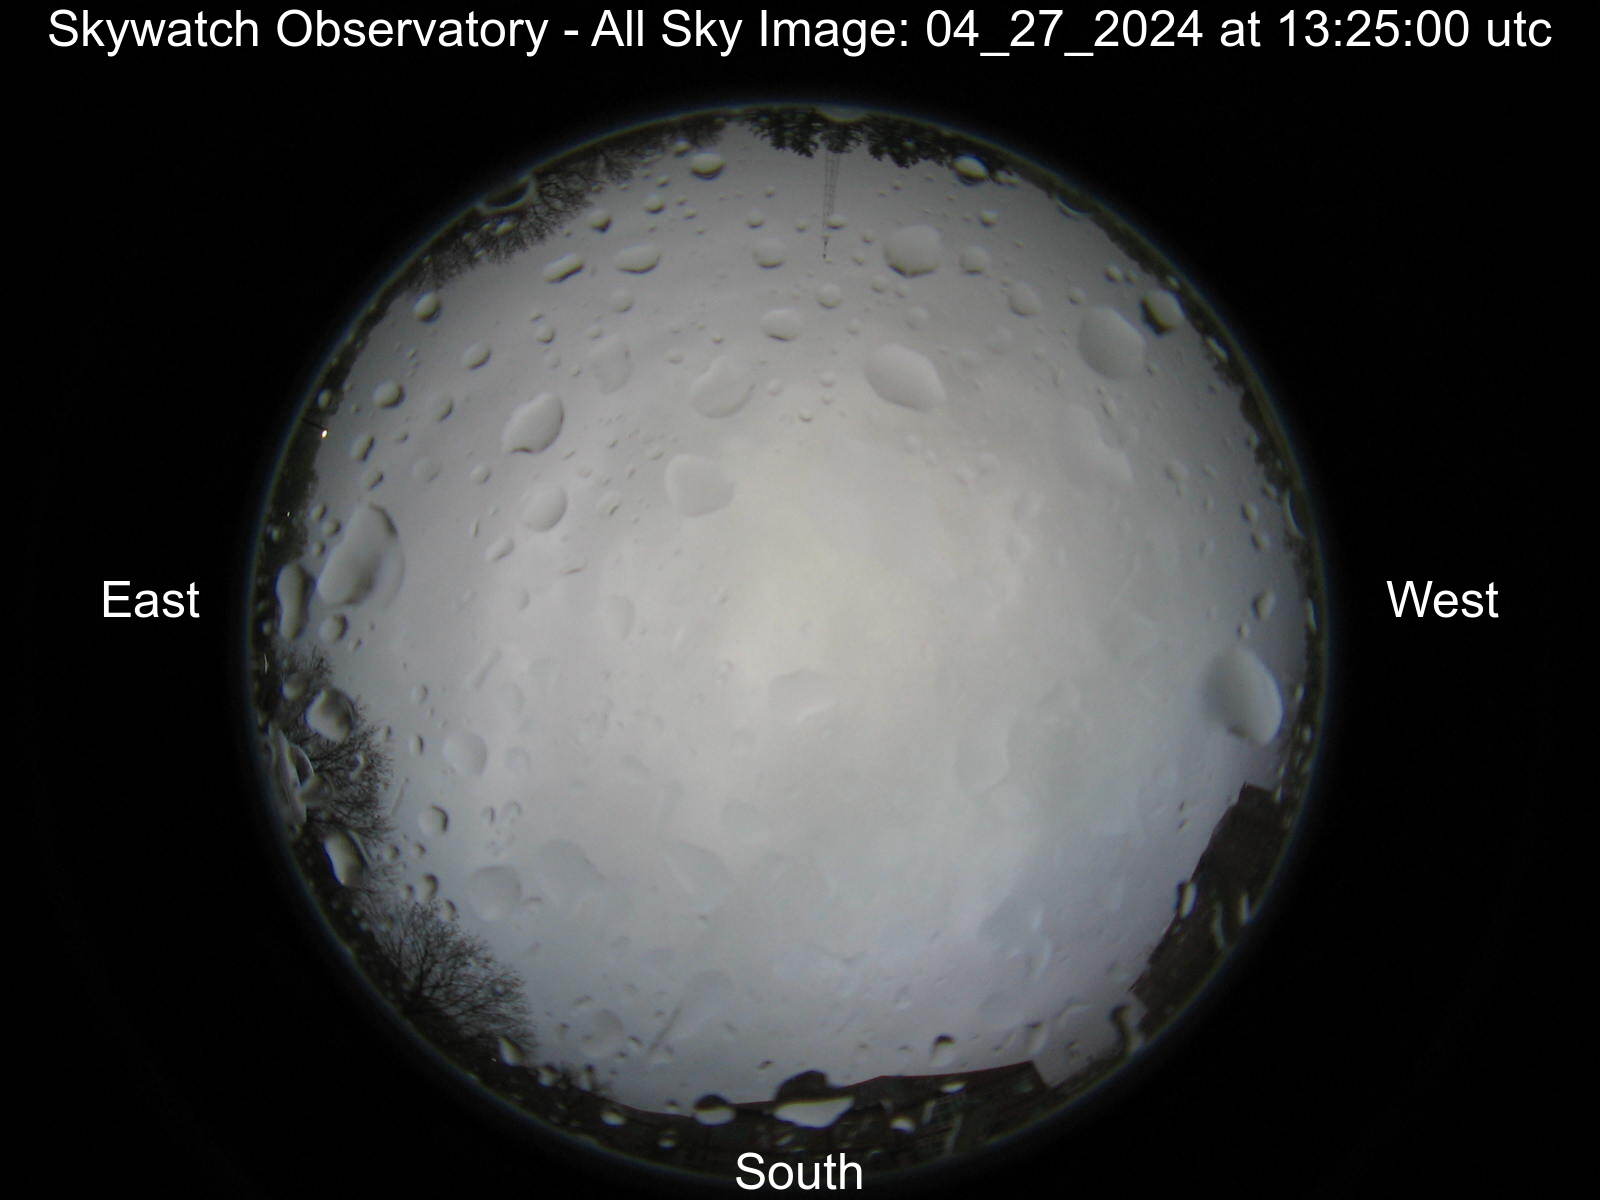
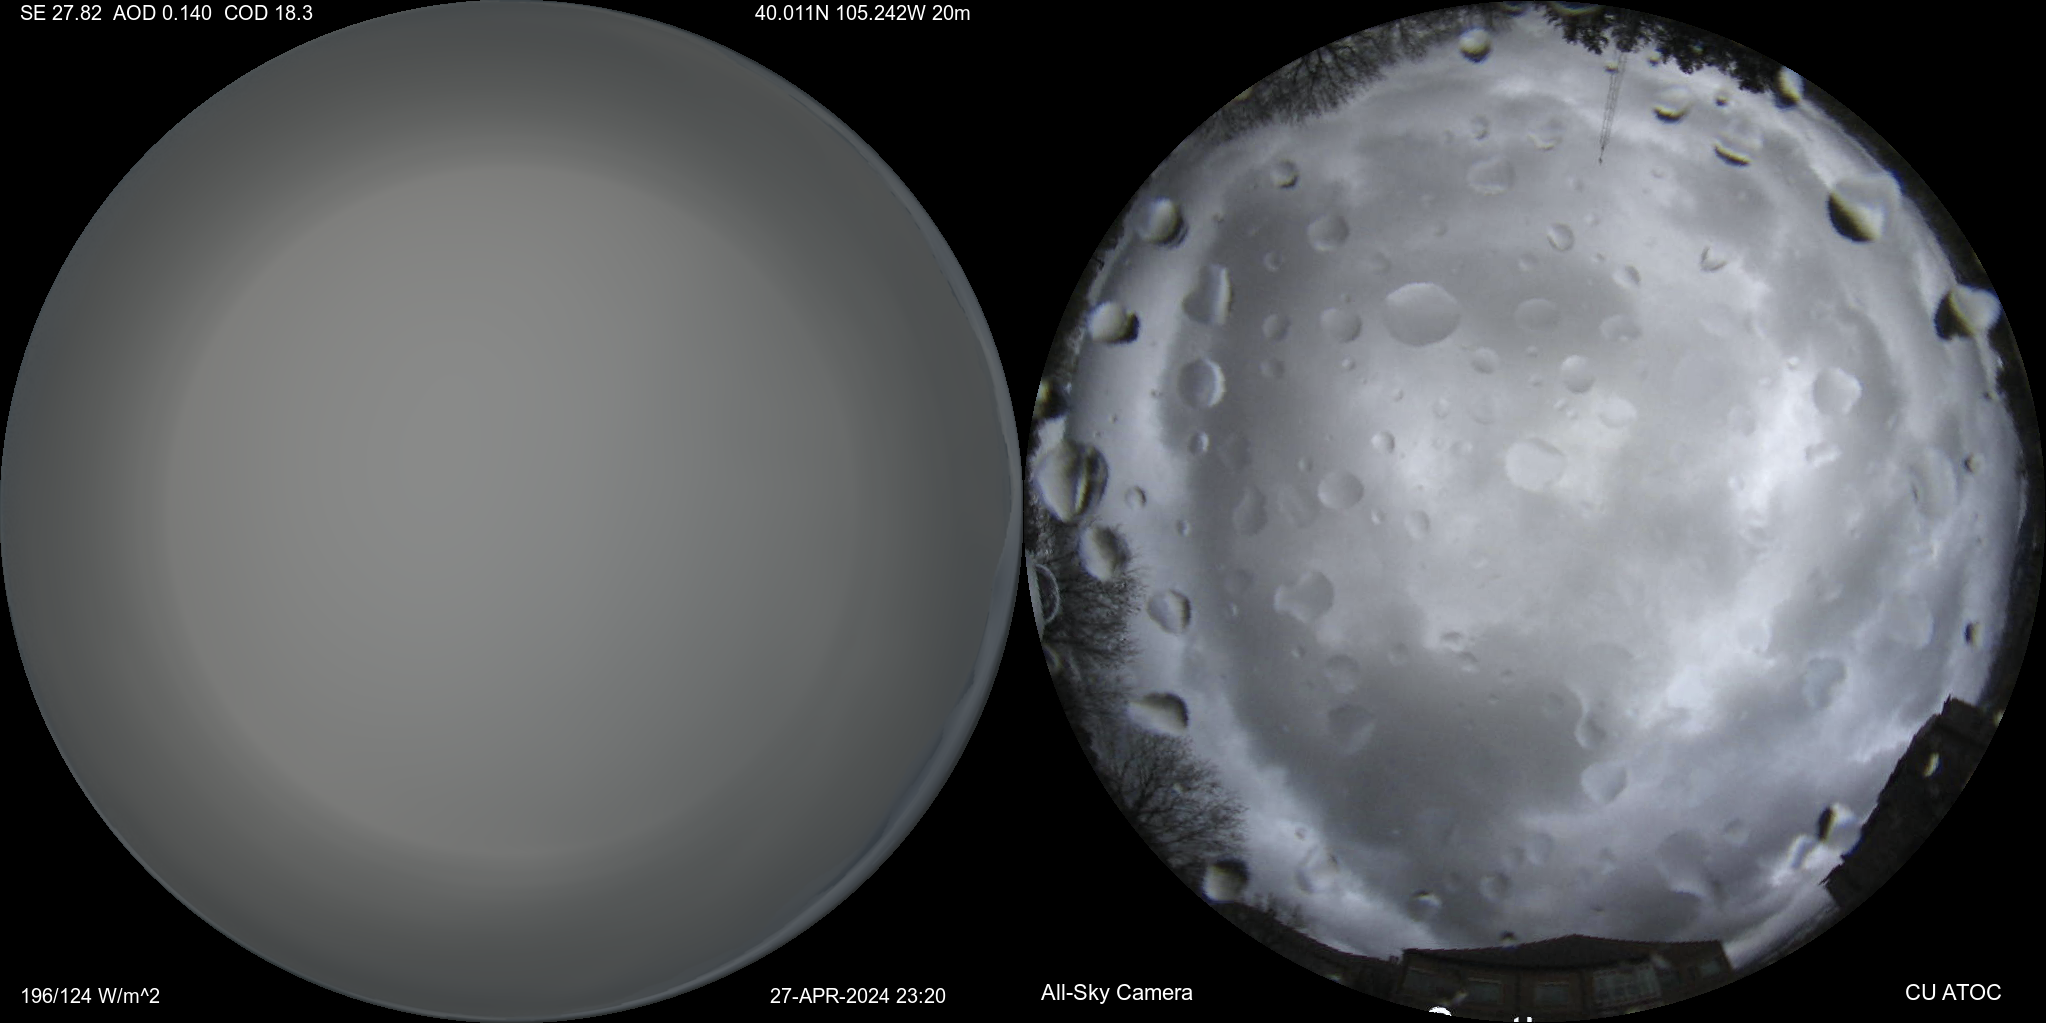 The image above on the left is simulated from the LAPS cloud/aerosol analysis including satellite, camera, and other data,
while the image on the right is taken at the same time by an EKO Instruments independent all-sky camera located at the CU
Skywatch Observatory
(ATOC).
In each fisheye lens view the zenith is in the center and north is up.
The color balance of the simulated image is set to reproduce the "actual" colors/radiances when the display white point is set to closely match the sun.
Thus to see a true apples to apples comparison (if for example you take your computer outside or right by a window), please set
your display to a color temperature of 5780K (the sun's white color above the atmosphere).
Some images are shown a bit dark to avoid saturating and losing details on the bright end. This can be compensated for by turning up your monitor
brightness, thus showing a broader dynamic range.
The image above on the left is simulated from the LAPS cloud/aerosol analysis including satellite, camera, and other data,
while the image on the right is taken at the same time by an EKO Instruments independent all-sky camera located at the CU
Skywatch Observatory
(ATOC).
In each fisheye lens view the zenith is in the center and north is up.
The color balance of the simulated image is set to reproduce the "actual" colors/radiances when the display white point is set to closely match the sun.
Thus to see a true apples to apples comparison (if for example you take your computer outside or right by a window), please set
your display to a color temperature of 5780K (the sun's white color above the atmosphere).
Some images are shown a bit dark to avoid saturating and losing details on the bright end. This can be compensated for by turning up your monitor
brightness, thus showing a broader dynamic range.
SE represents solar elevation angle in the legend and COD represents zenithal cloud optical depth from the cloud analysis.
The simulated solar irradiance (GHI) is in the lower left of the simulated image in W/m^2.
The first number is from the cloud analysis where GHI is calculated as a 2D field,
while the second number is based on an angular integration of the simulated sky image.
Latest all-sky comparison
difference image
|
mask
Latest comparison animations
(site is ATOC):
Polar
|
Cylindrical
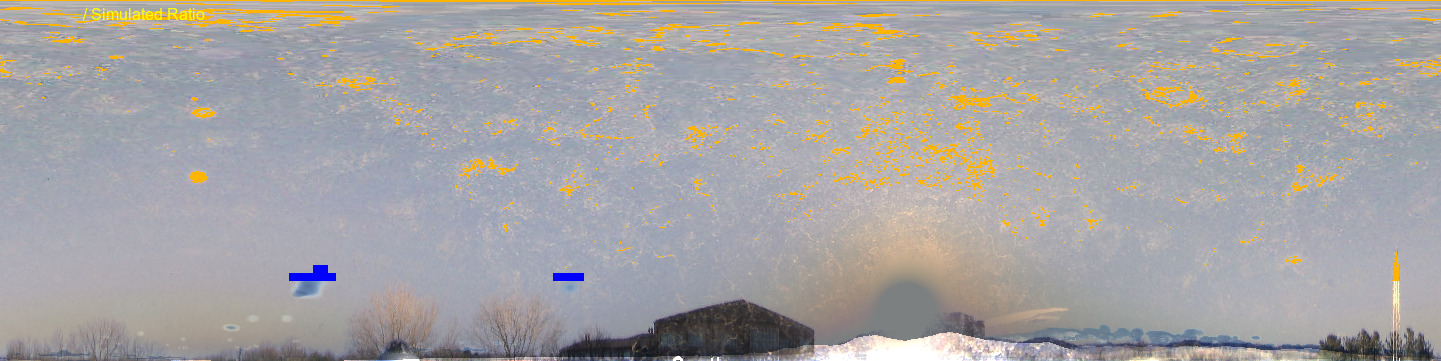
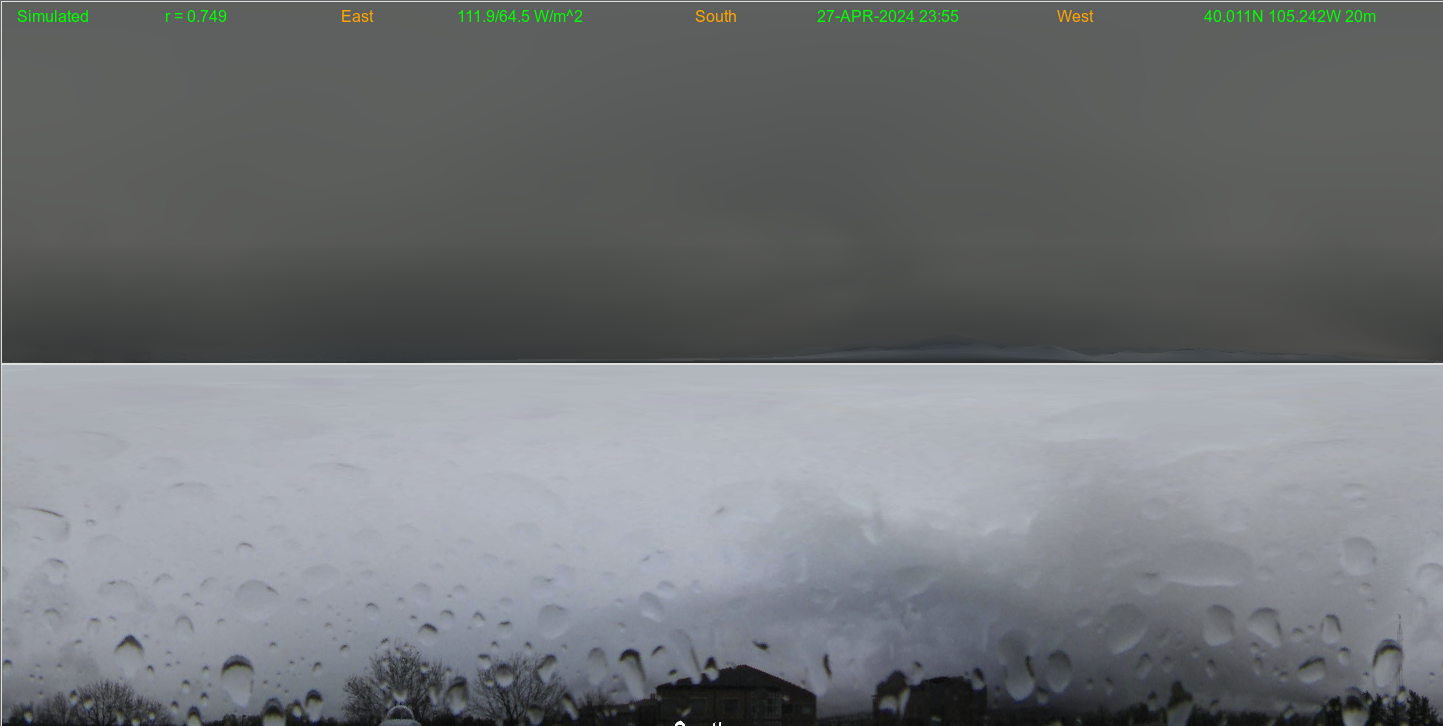 In these 360 degree panoramic (all-sky) views, a simulated cloud/aerosol analysis (using satellite though no camera) image is shown (top) compared with a remapped independent camera image (second)
from an all-sky camera located at CU/ATOC.
South is at the center of each image and north is at the edges.
The listed solar irradiance is calculated from the same radiance information used to construct the image.
In these 360 degree panoramic (all-sky) views, a simulated cloud/aerosol analysis (using satellite though no camera) image is shown (top) compared with a remapped independent camera image (second)
from an all-sky camera located at CU/ATOC.
South is at the center of each image and north is at the edges.
The listed solar irradiance is calculated from the same radiance information used to construct the image.
Archive Directories
(site is ATOC):
Polar Comparison
|
Polar Blinking
|
Cylindrical Comparison
|
Diff Mask
|
Cam Modified Cyl
Other Related Endeavors
from around the web
More visualizations are on my main
home page
|
Contact:
Steve Albers
(Steven.Albers@colostate.edu)