JPEG, PNG- (image updated 10/21/2011)
I have some other global Venus images, one of which is shown here. This is a combination of two images. The hue information comes from Calvin Hamilton's cylindrical map . The shaded-relief (intensity) information is used from A. Tayfun Oner's Venus topography map . Tayfun's black & white map was warped from a Mercator onto the Cylindrical projection shown here at a resolution of 1000x2000 pixels. Red and white colors are highest and the light source comes from the right (east) side.
We are making real-time weather satellite movies (~4K) by processing half-hourly stitched global IR McIDAS images obtained from the Aviation Weather Center. These are being enhanced with independently obtained perspective views of MTSAT full-disk images. In addition we are constructing sea surface temperature and anomaly movies from the NCODA analyses. Other geophysical datasets include real-time GFS forecast model displays.
We are making a
population movie
for the Earth based upon a DVD movie from the
Population Connection
as well as
the "Blue Marble" image
(updated 3/9/2005).
Population growth is depicted (using every 10th DVD frame) from 17AD to 1949AD.
We are using
this map
(8K) of the Moon created by Jens Meyer.
He processed a map derived from Clementine spacecraft data
that is available on the
USGS PDS web site.
The version linked here was darkened slightly from the original
(updated 2/11/2005).
We are planning to also use
this map
from
Phil Stooke.
We are utilizing a spectacular
Jupiter movie from Cassini (2D Interpolated)
for the
Science on a Sphere. I applied some simple processing to produce this
28MB tar file
(updated 7/7/2004)
containing separate GIF images for the 197 frame color movie.
The resolution of the image is 2 pixels per degree and the original animiated
GIF was cropped to 360x720 pixels. The data void space near the poles (outside
of +/-68 degrees latitude) was filled with a neutral color.
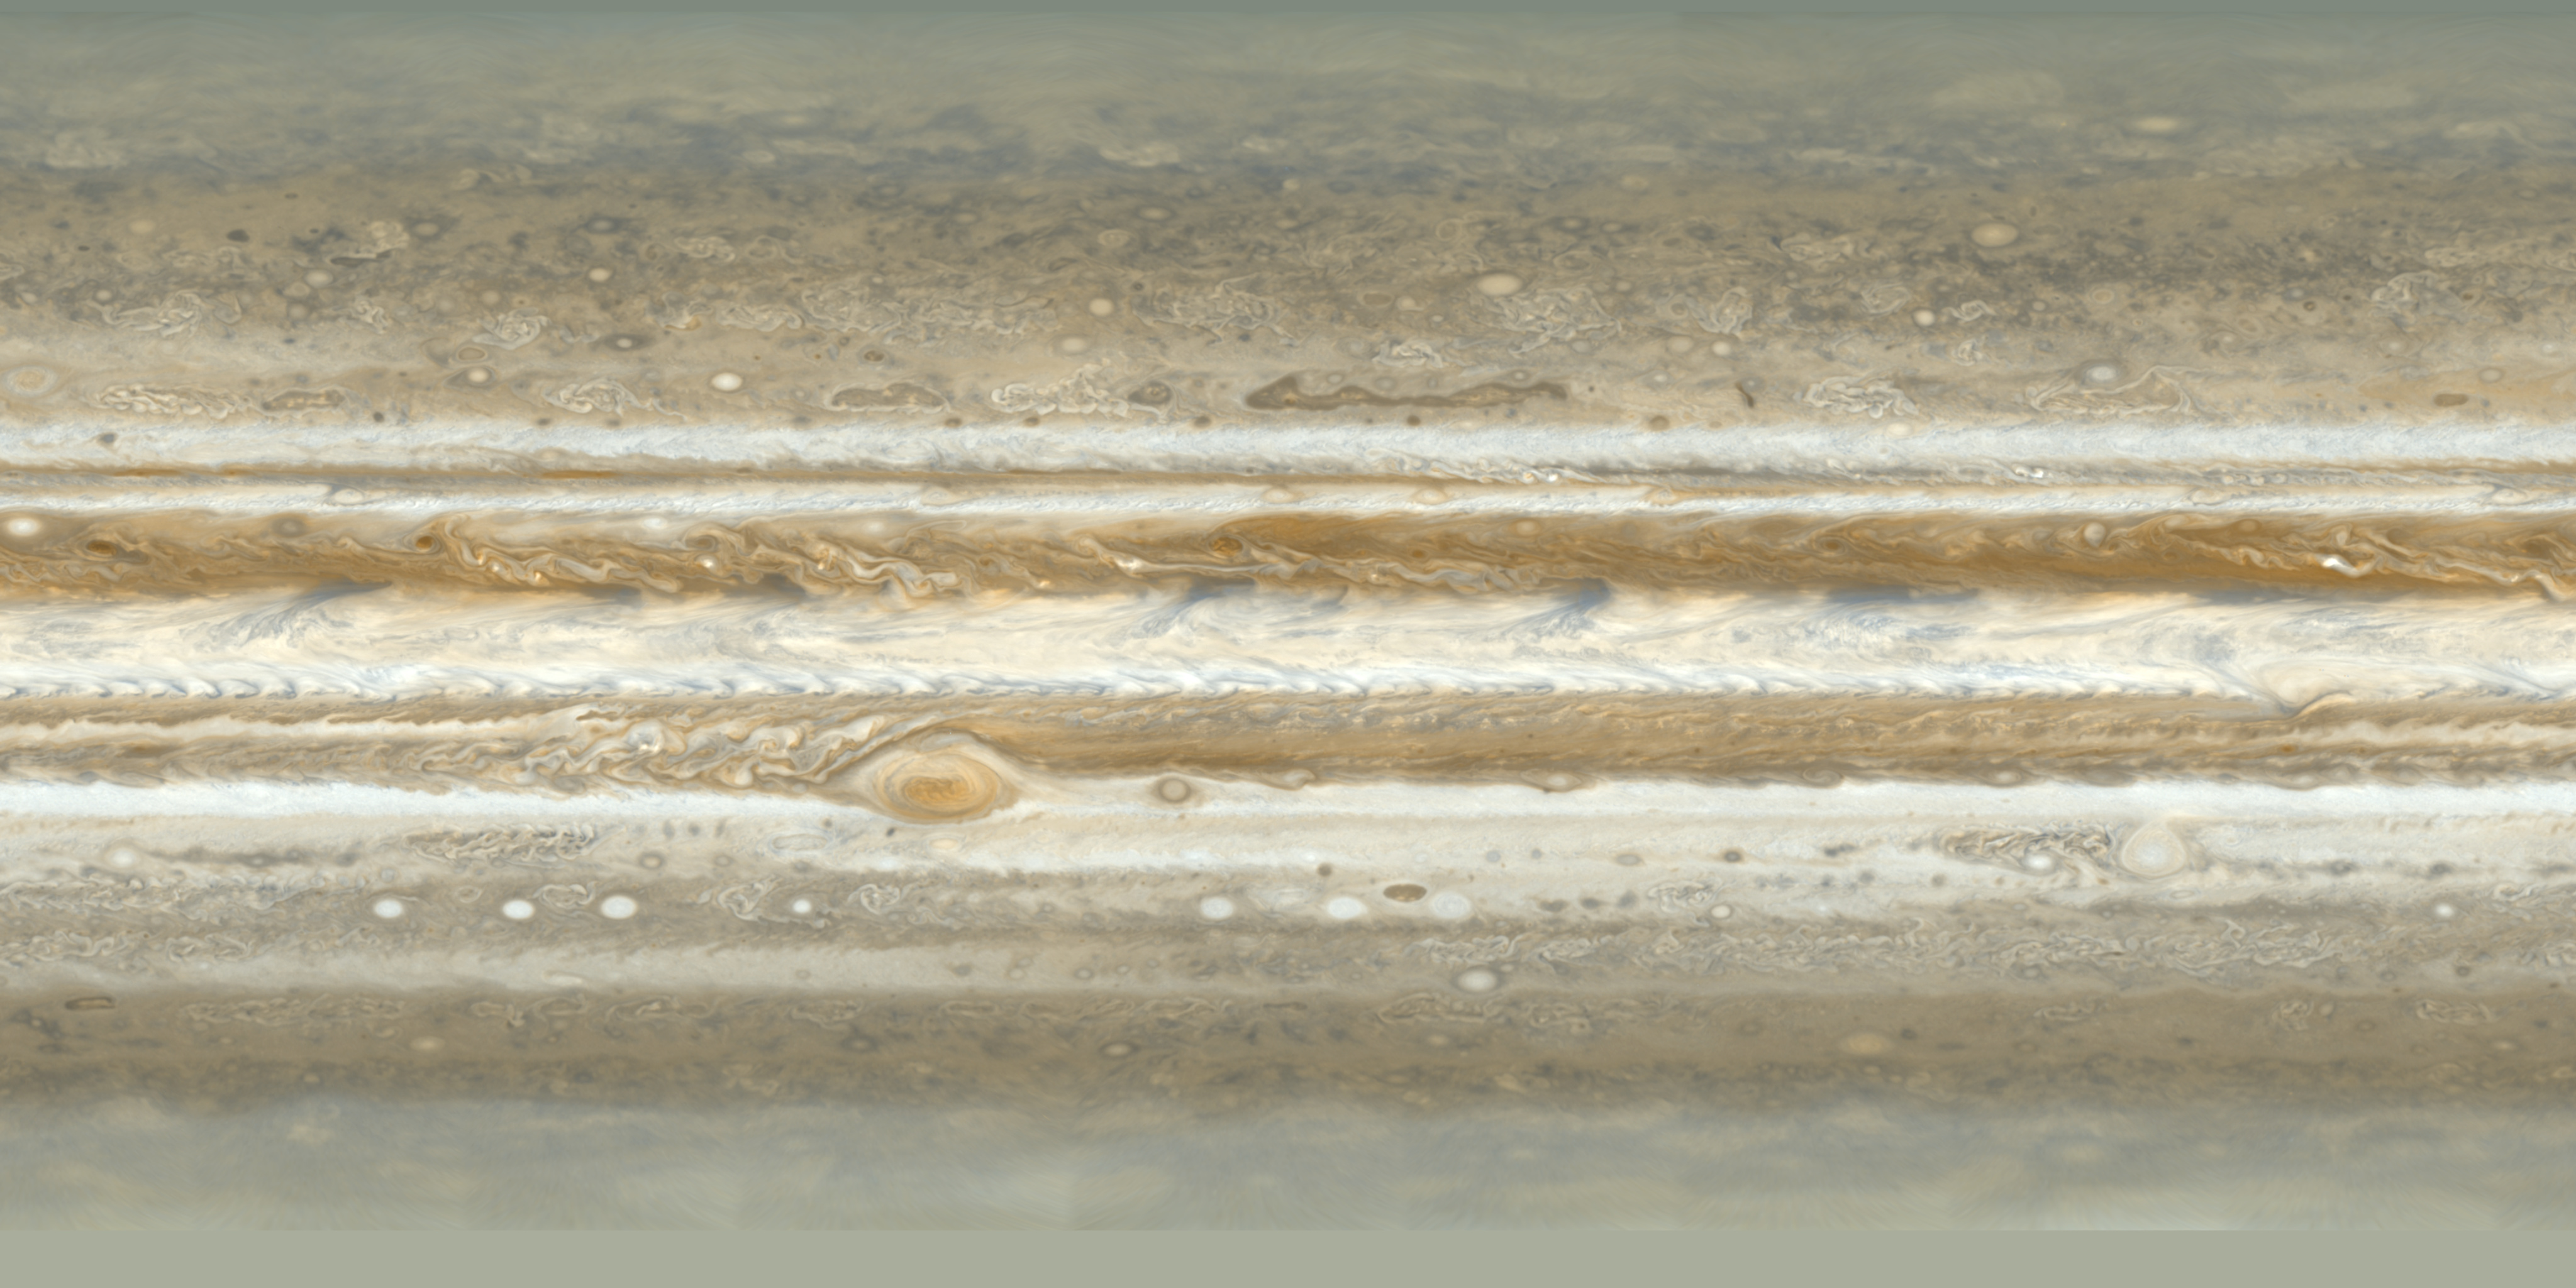
We are also using
this Cassini map
to construct a higher resolution still image. The image was resized to 4K and
the color balance was adjusted in a subjective attempt (as suggested by
Bjorn Jonsson) to better match the visual appearance of Jupiter in a telescope.
Even though this has a degree of artistic license, it's interesting to see
Bjorn's merged map
using Cassini and Juno data.
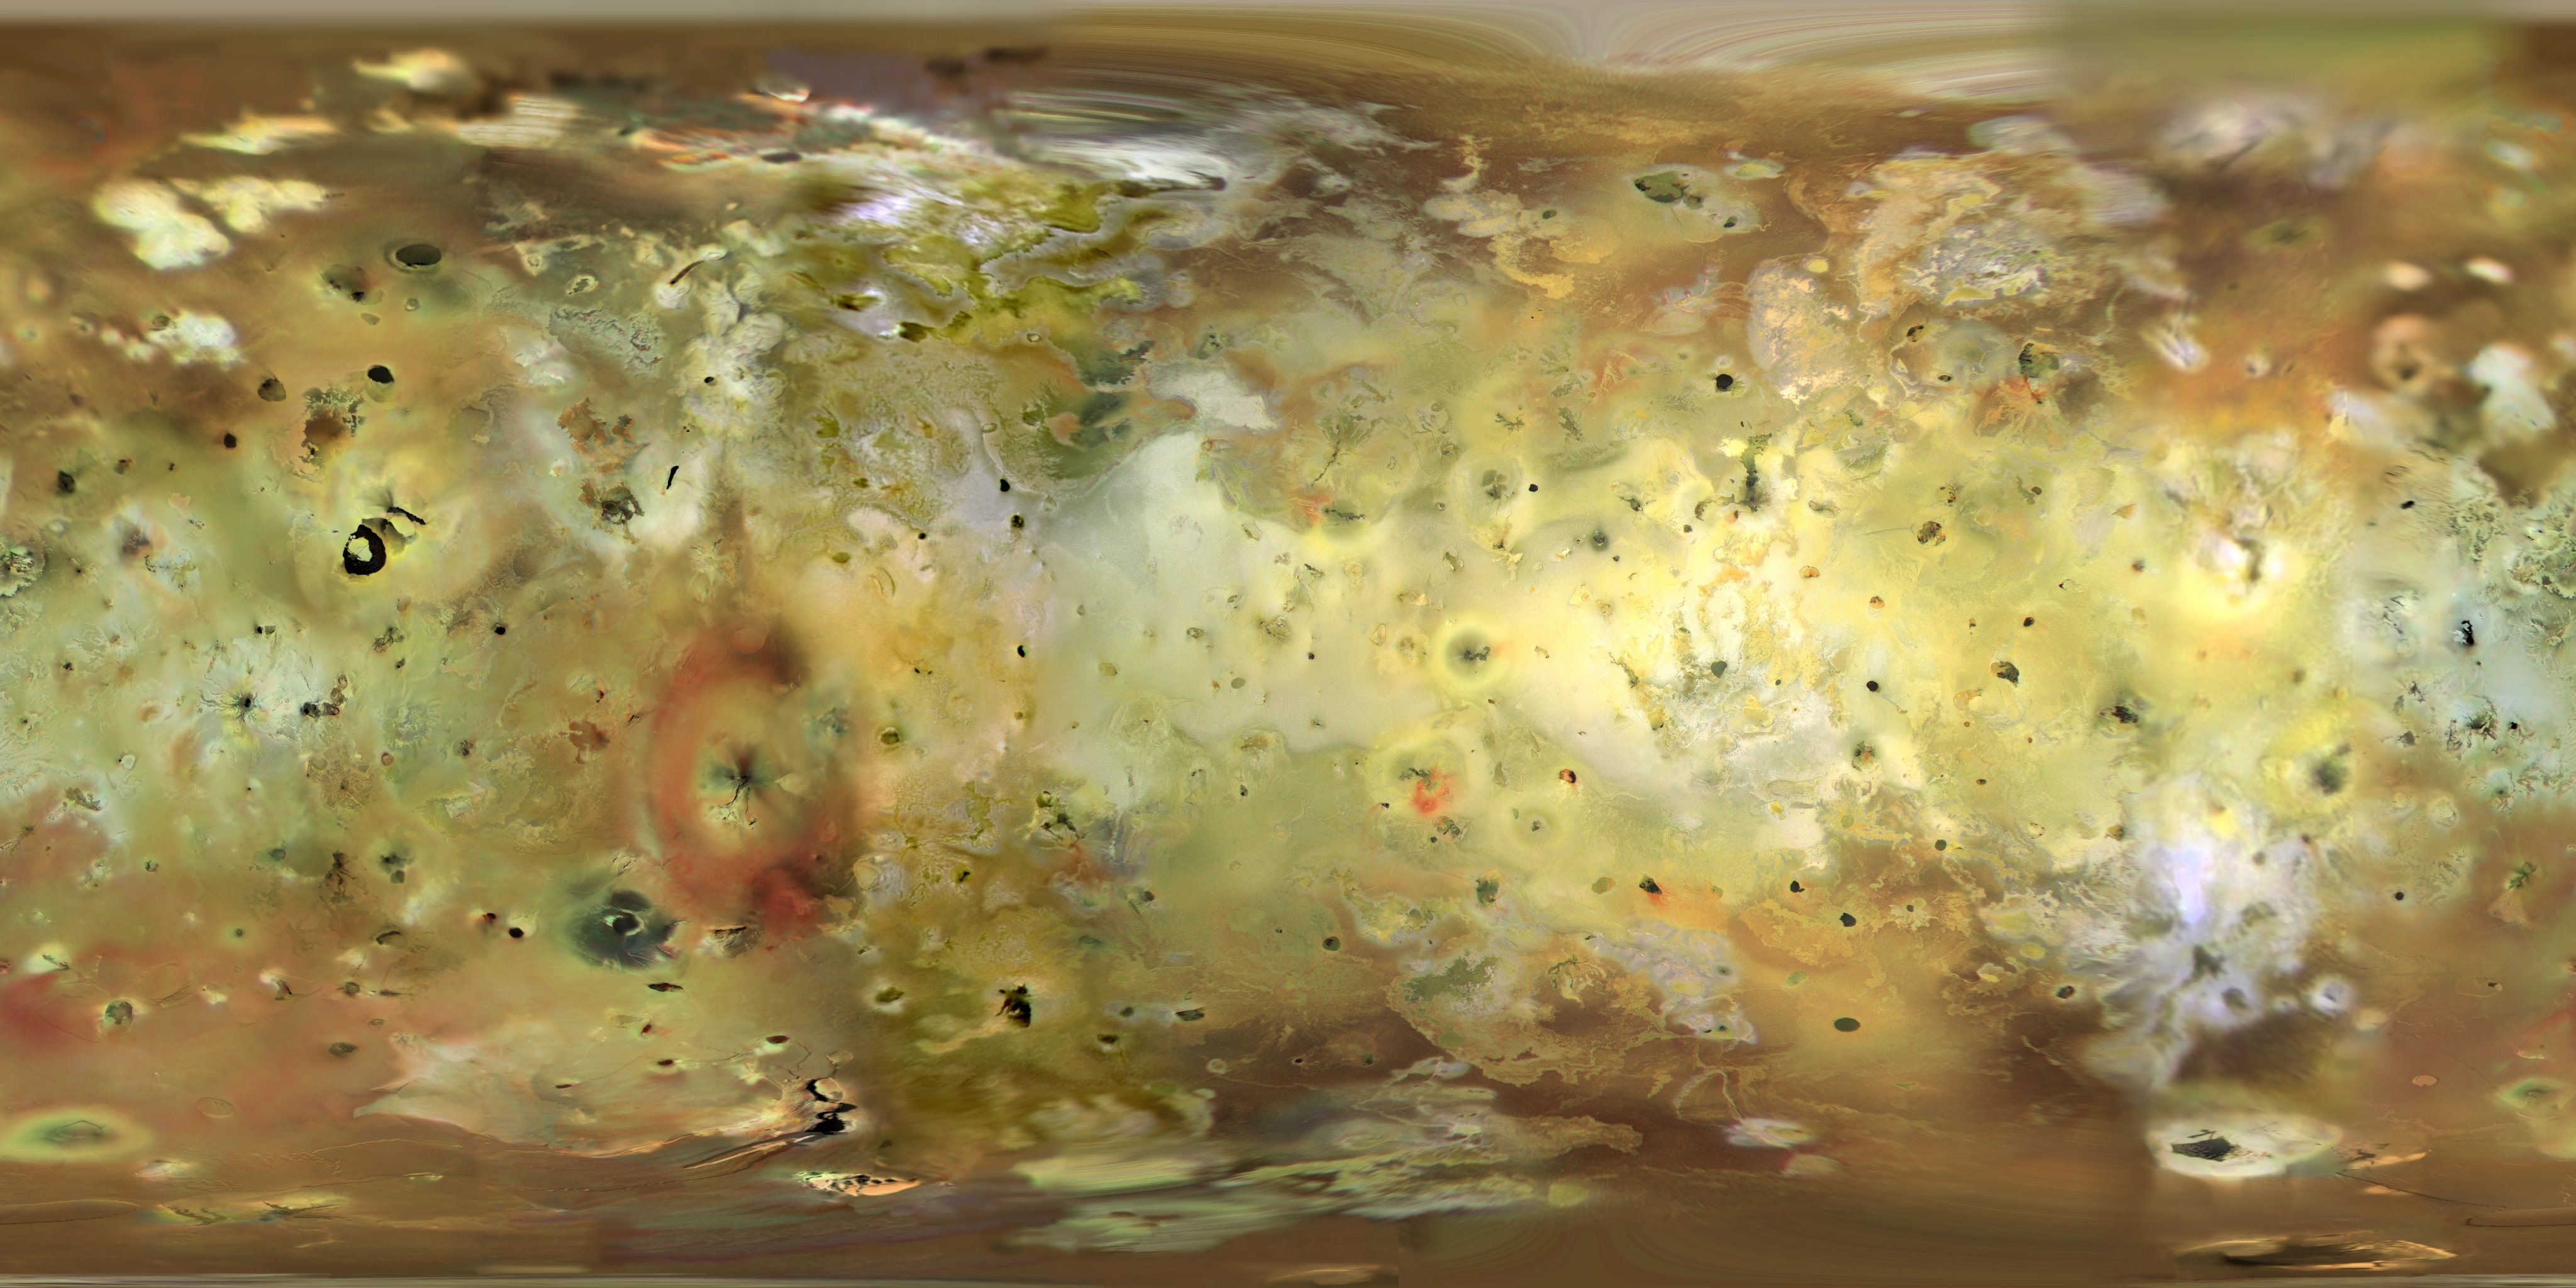
For the second image a near-hemispheric
Galileo mosaic
was used for about 40% of the map. This was reprojected
from a vertical perspective projection (spacecraft view -
similar to orthographic)
onto the cylindrical lat/lon grid.
For the third image a portion of this
Galileo mosaic
was reprojected to cover about
10% of the map.
The color balance was adjusted and saturation was subdued to undo the
"enhanced" color in the posted Galileo image.
The fourth image comes from a portion of this
Galileo mosaic,
reprojected to cover
the remaining 10% of the map.
This fourth color image was augmented by
higher resolution intensity information from a
black and white USGS map.
Seams were blended gradually between the various images to reduce
their prominence.
Some further color adjustments are being made to compensate
for the extended wavelength range of the Galileo filters.
We are also using a similar map from the USGS that is of very high quality.
We are using a
modified higher resolution
version of
this map
of Ganymede created by
Bjorn Jonsson.
The modifications include localized
areas where details from a USGS map were blended in. The navigation of Bjorn's
image was also adjusted slightly to better match the USGS map.
We are using a modified version of
this map
of Callisto created by
Bjorn Jonsson.
Following is a series of satellite maps representing a combination of Voyager and Cassini spacecraft
imagery. Navigation information used in reprojecting
Cassini images was obtained in part
from Mark Showalter's Cassini Satellite ephemeris website.
A helpful
image summary
is being used courtesy of The Planetary Society.
Matching of topographic
features was also done to help in registering the images.
It is anticipated that the typical accuracy of the navigation of
the images is roughly within the 1-2 degree range.
Please note that some of the Cassini images used are "raw" images that are uncalibrated and unprocessed.
Below is a map of Mimas I constructed by
reprojecting and overlaying about 15 Cassini images representing
~90% coverage on top of the official mosaic found on the Cassini web site (used for ~10% coverage).
The Cassini images and mosaics are from NASA/JPL/Space Science Institute.
I'm currently working on a
feature overlay.
This is a 4K image with the feature names on top
where the fonts are "pre-distorted" to display well on SOS, Celestia, etc.
(updated 2/25/2012).
Moon
Mars
Phobos
Deimos
Asteroid Belt
Ceres (Dwarf Planet)
Here are
north polar
and
south polar
views.
Vesta
Ida
Gaspra
Mathilde
Eros
Itokawa
Comets
81P/Wild-2
Jupiter
JPEG,
TIFF-
(image updated 3/31/2006)
Io
JPEG (1MB),
TIFF (25MB),
with features-
(images updated 10/9/2023)
Europa
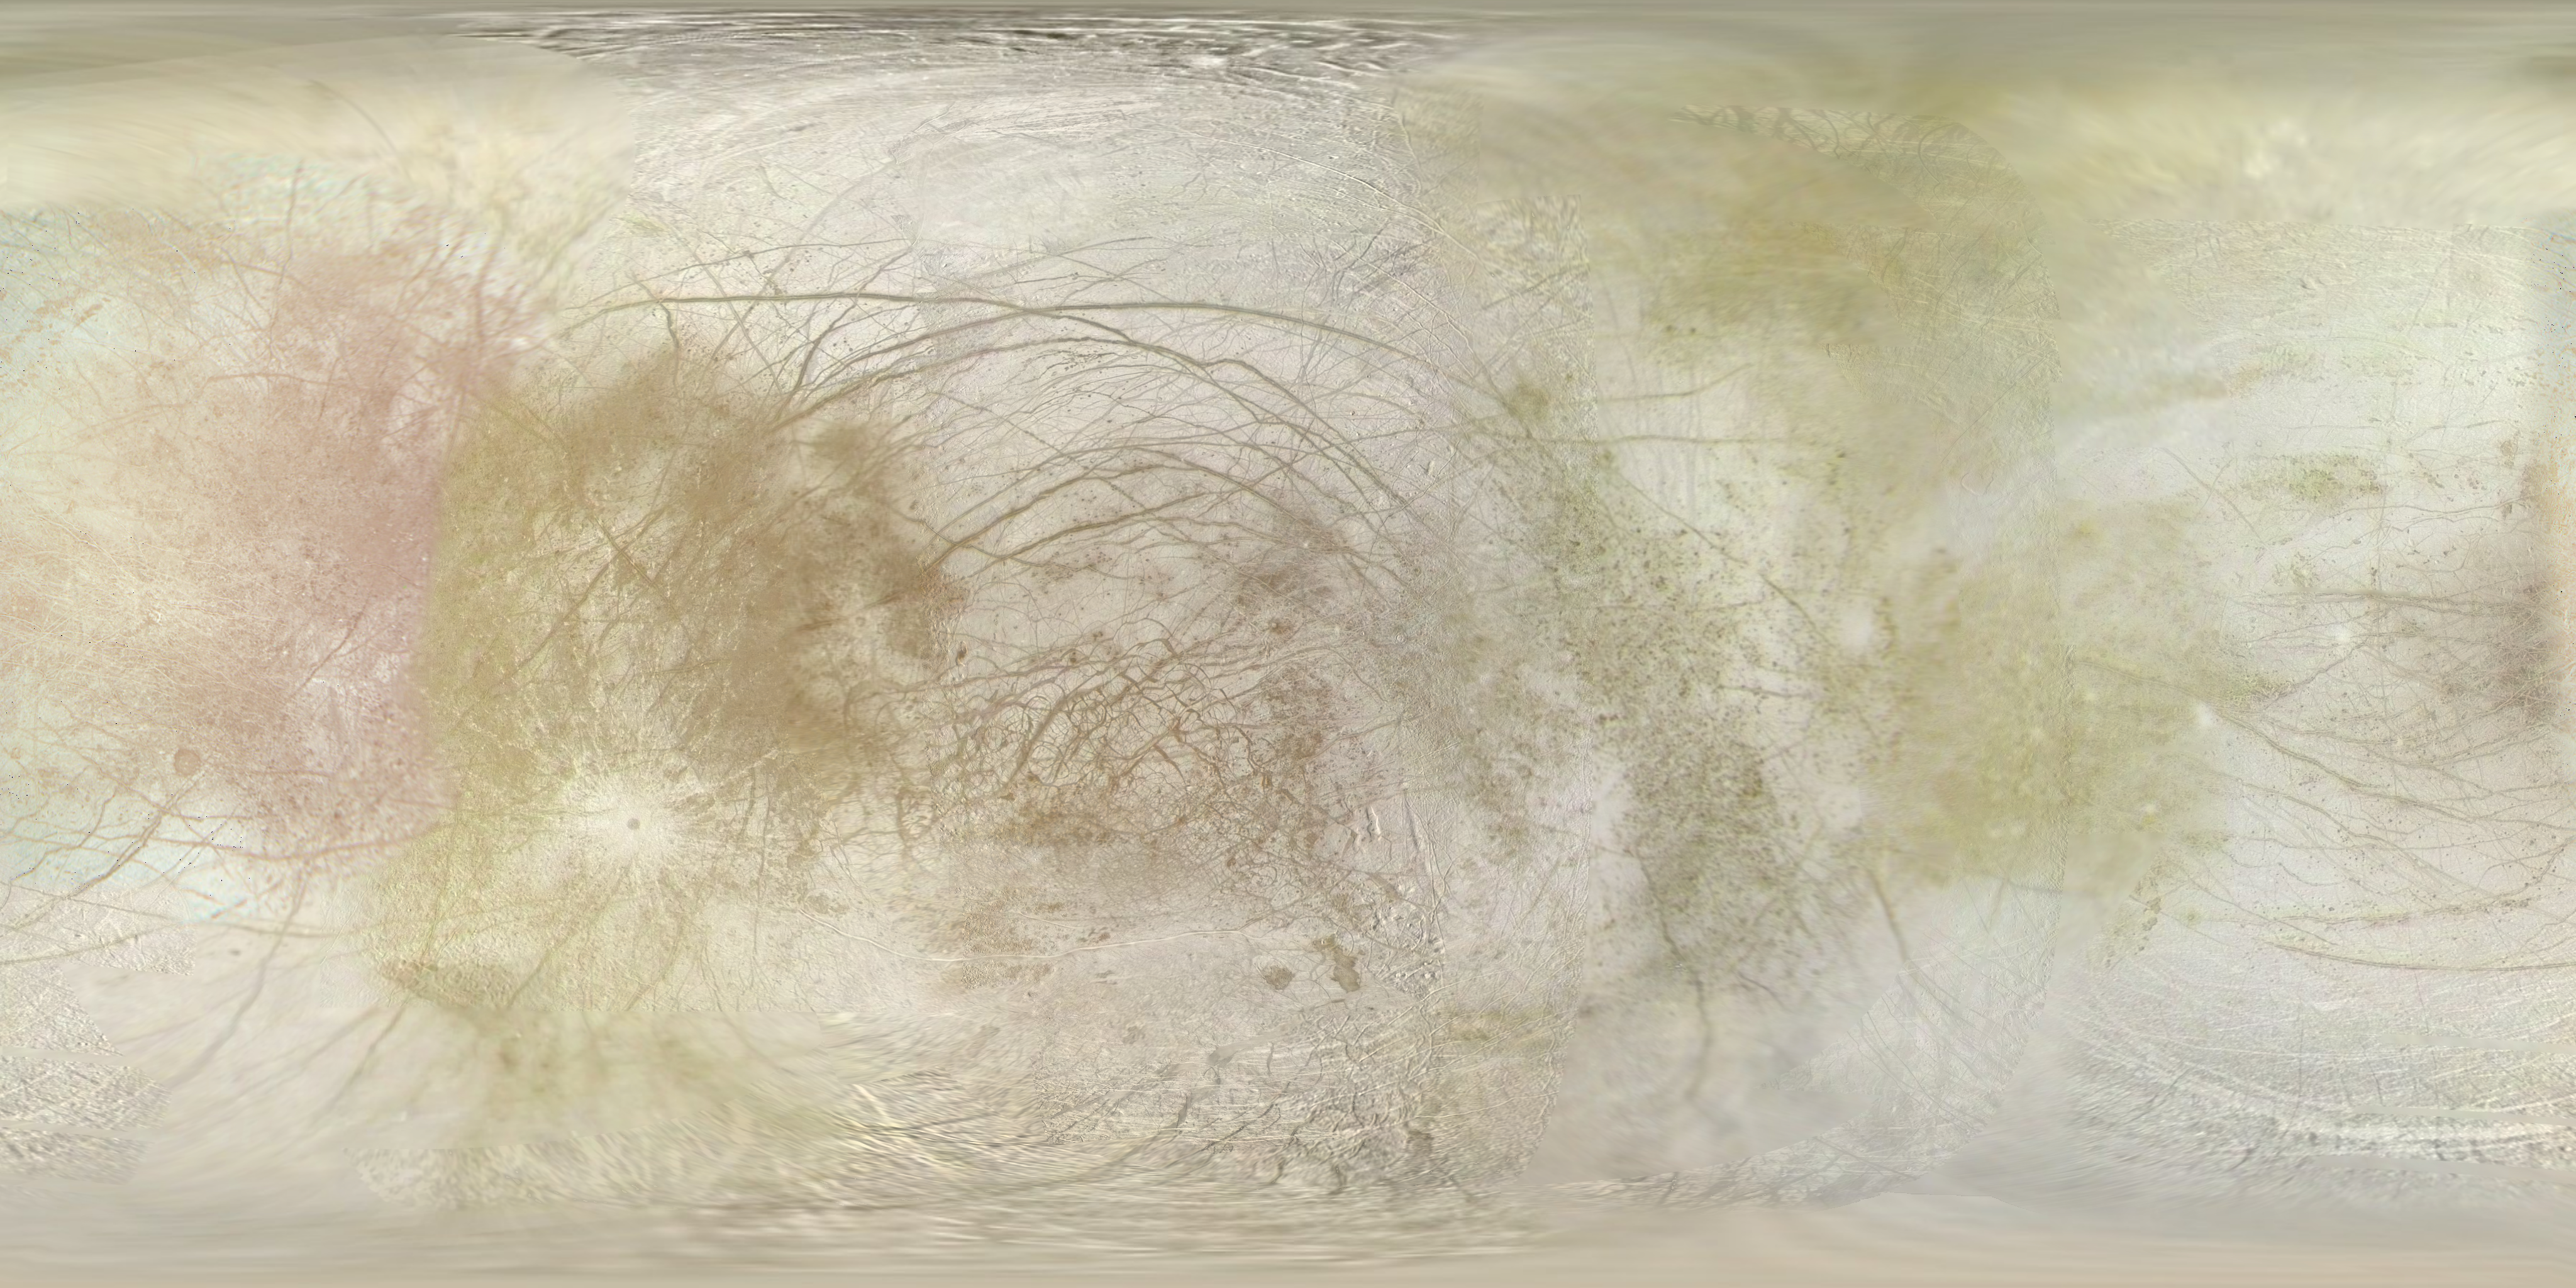
4K PNG,
Feature map-
(images updated 10/2/2022)
Ganymede
Callisto
Saturn
Mimas
JPEG,
PNG,
PNG (with feature labels)-
(image updated 12/20/2012)
Enceladus
JPEG,
PNG-
(image updated 12/18/2009)
Enceladus Map Sheet

Full Size,
Half Size
-
(image updated 11/22/2006)
Tethys
JPEG,
TIFF-
(image updated 12/19/2008)
Dione
JPEG,
PNG-
(image updated 10/22/2010)
Rhea
Ariel
Neptune
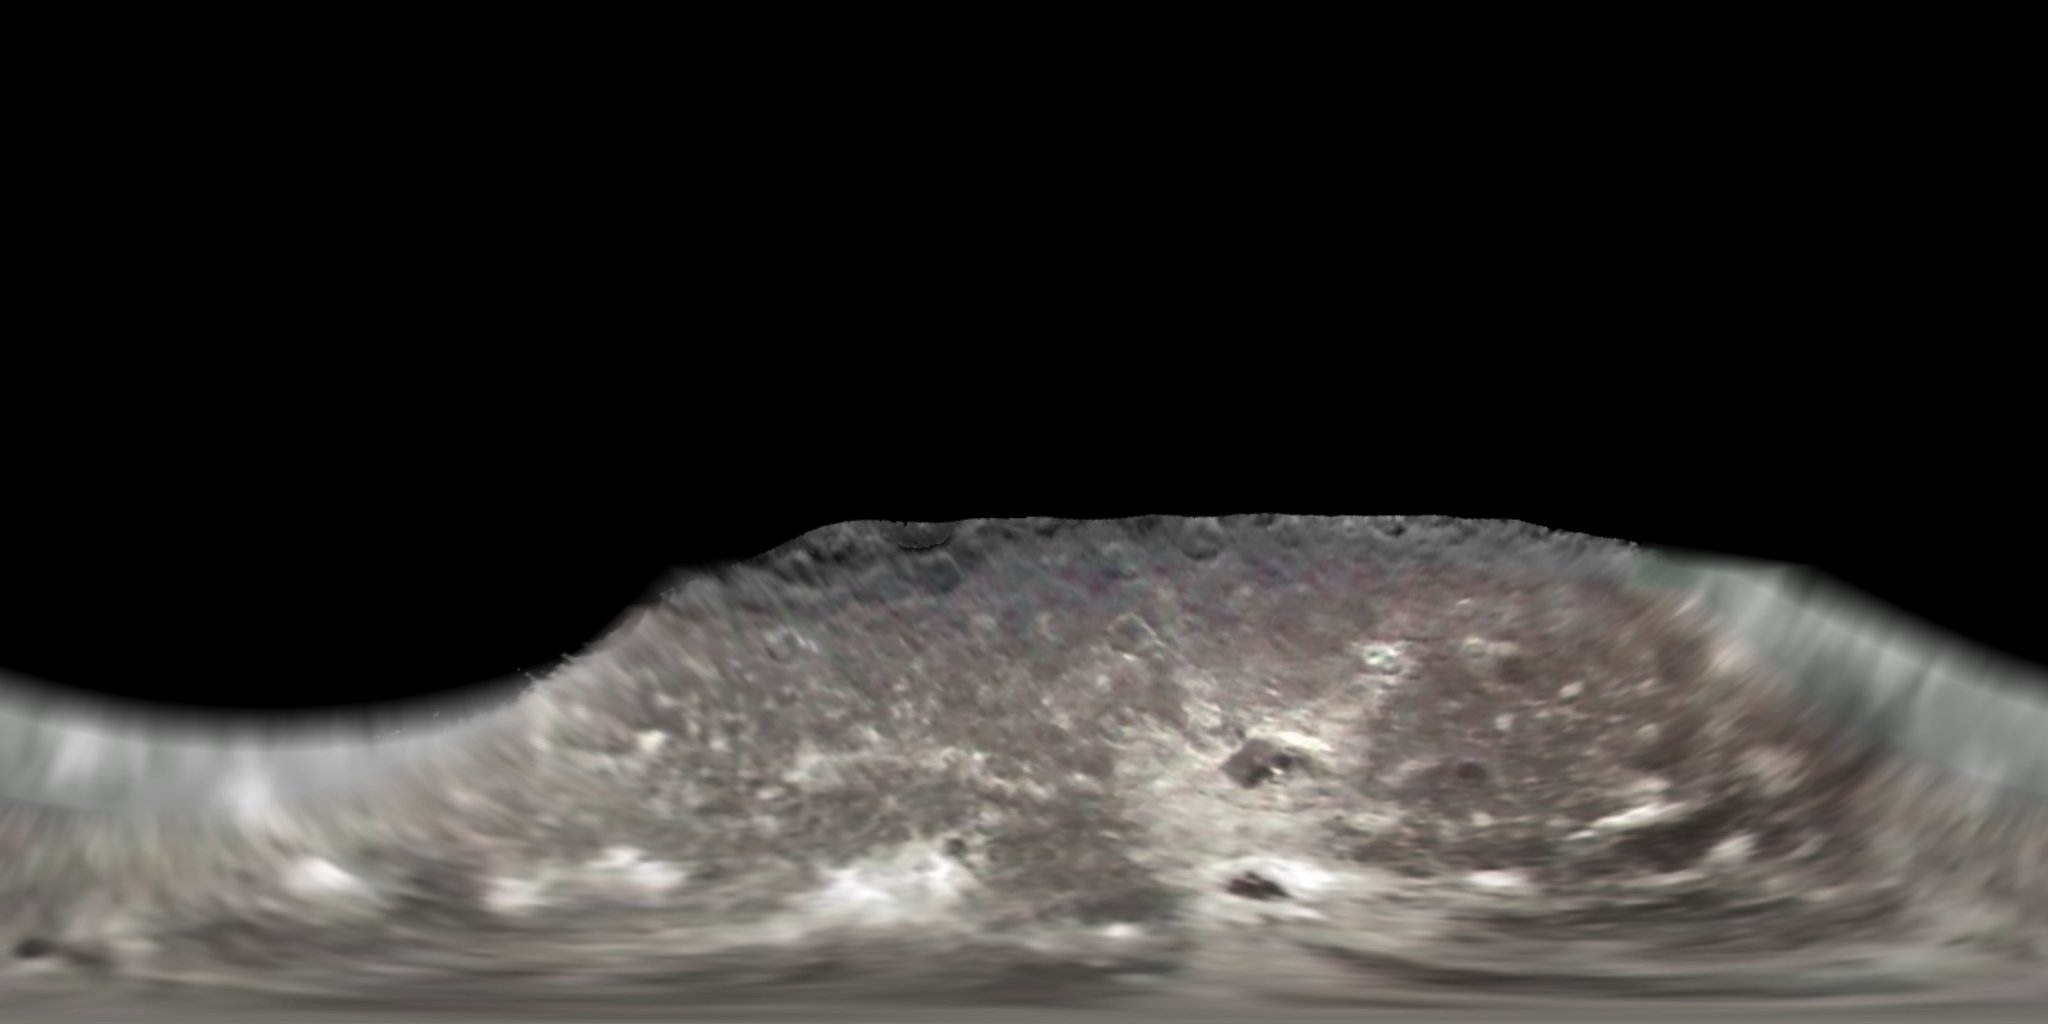
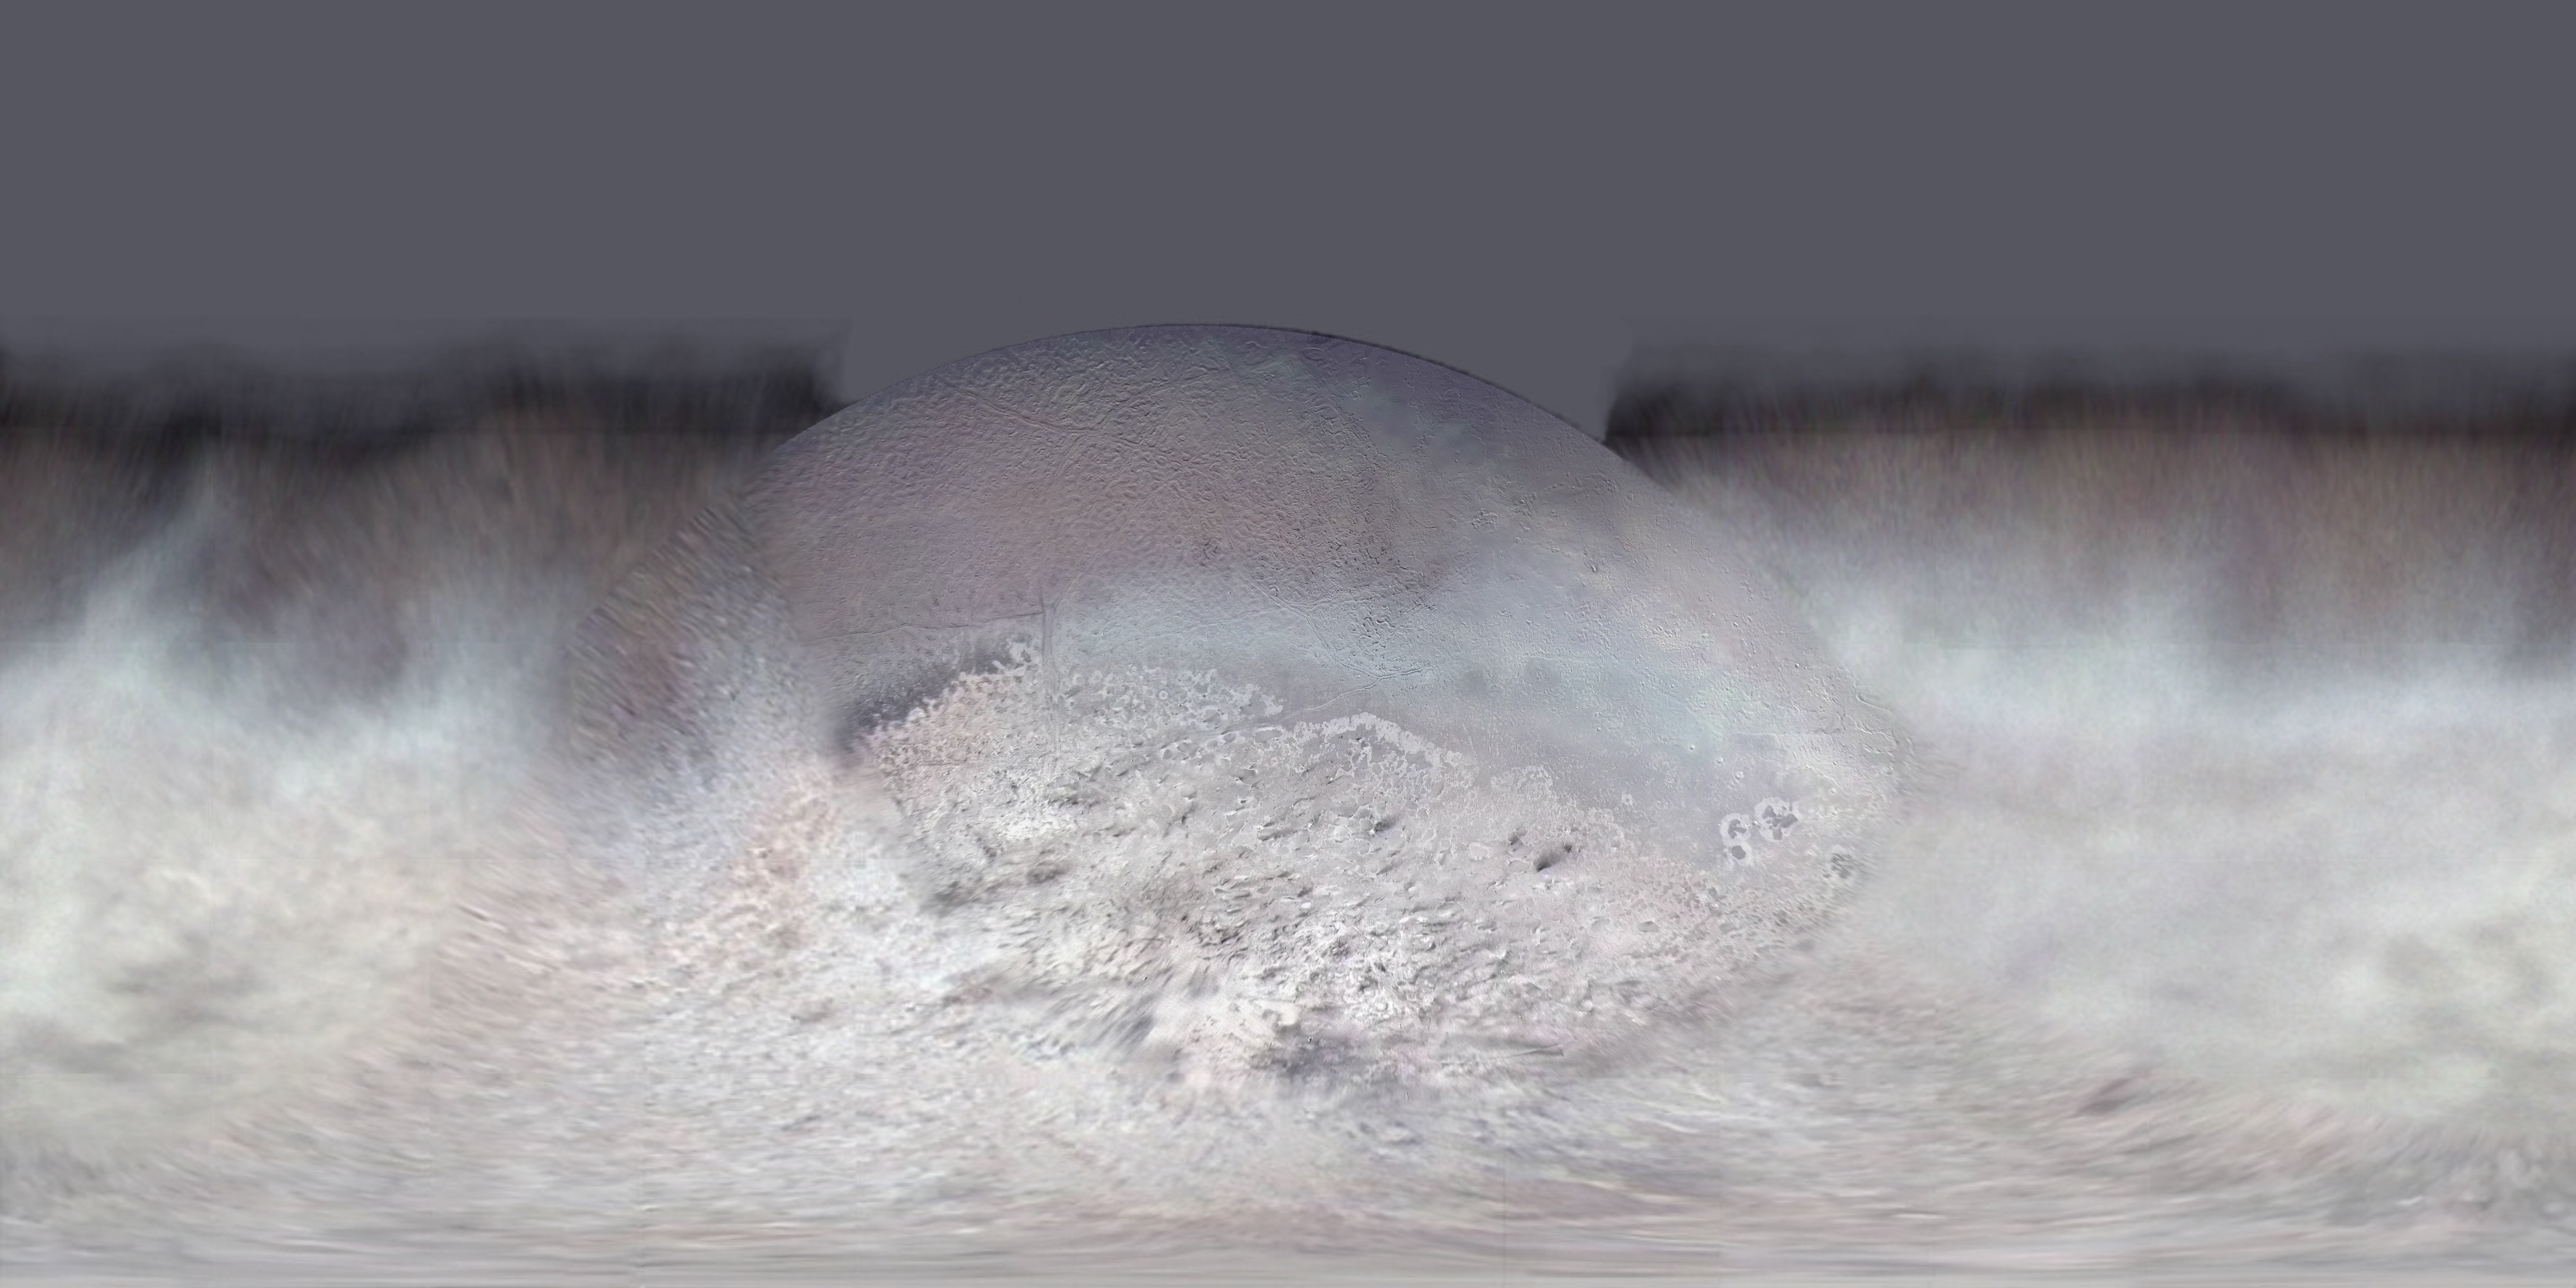
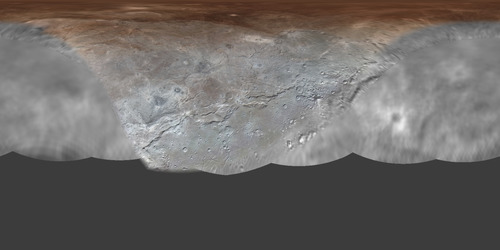
Triton

Copyright: The images on this page are intended for personal non-commercial use only. For additional information please contact me at steven.albers@colostate.edu.
For Celestia users here are some versions with a zero degree central longitude
For Celestia and other users here are some versions with feature names overlain. The font is "pre-distorted" so it shows up well on a spherical projection. The nomenclature for the feature maps is from the USGS Gazeteer