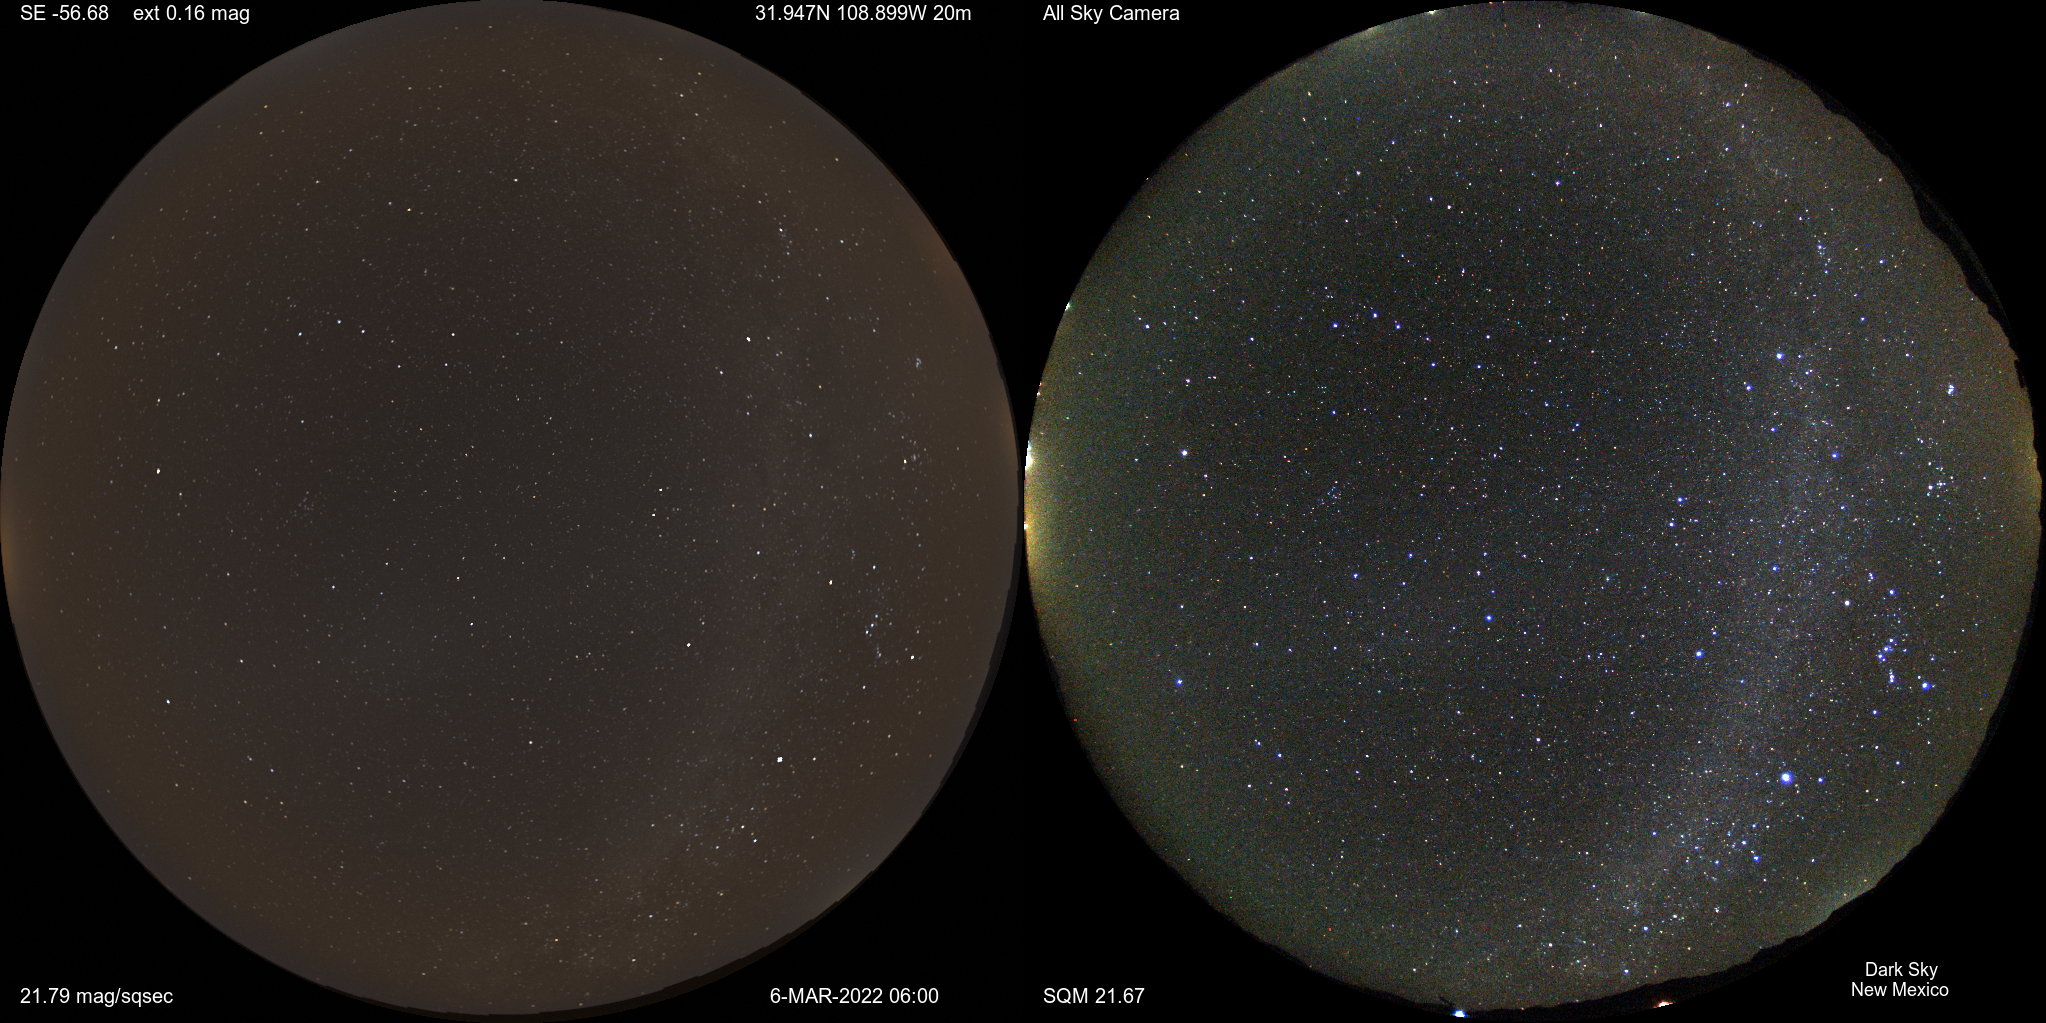
A nighttime simulated view (left) in a rural location includes stars from the Gaia Catalogue, and other aspects of the night sky compared with a camera image (right). Here are live nighttime sky simulations at two rural observatories including Dark Sky New Mexico and Solar Hills Observatory. Here is the SOHO instrument data website.
Effects of clouds, aerosols, airglow, aurora, moonlight, and city lights are included in the simulations. The labels in both images compare the sky brightness (Sky Quality Meter - SQM) indicated in V-band magnitudes per square arcsecond. "SE" denotes the solar elevation angle and "ext" denotes the zenithal combined extinction in magnitudes from gas, aerosols, and clouds.
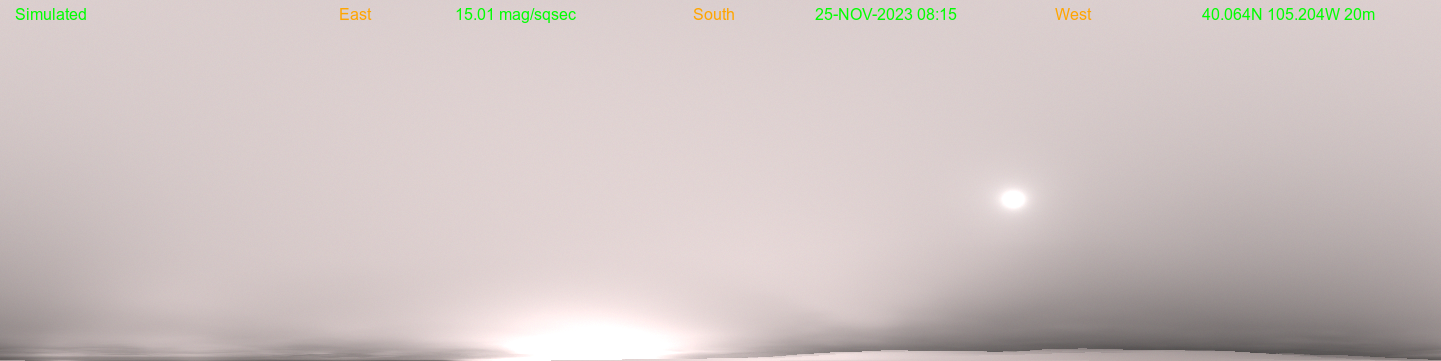
The above simulated image shows city lights from Denver scattering off of clouds on a snowy night as seen from between Boulder and Longmont, Colorado. The moon is also shown filtering through the icy clouds.
For city lights we can consider a variety of situations such as distant light domes with clear dark skies in rural locations or more local lights reflecting off of clouds. The sources of these artifical lights at night (ALAN) are taken from a static 700m resolution global map developed from the VIIRS polar orbiting satellite instrument. Aerosols are treated with single scattering at each grid box using a phase angle associated with the mean direction of the lights reaching that grid box. A 3D field of both upward and scalar spectral irradiance is calculated at each grid box with an approximate evaluation of an integral of the illumination from each surface grid box for the 3D grid volume in question. The scalar irradiance is useful for the single scattering calculation involving the gas and aerosols while the upward irradiance is useful to evaluate the radiance of the cloud component. Cloud scattering is treated as Lambertian with a consideration of their opacity. This approach has some similarities to a more complex model published by Roy Garstang.
At night we're now using a real-time aurora model forecast that is updated on a sub-hourly basis. Data from the NOAA/SPWC Ovation model is utilized to derive 3D aurora spectral radiance information for projecting into the viewer perspective. There are opportunities to compare the simulations with several types of observations in visible light. This includes ground-based camera images, ground-based photometers, as well as images and radiances from realtime VIIRS measurements. Aerosols and clouds are being analyzed in near real-time using an enhanced version of the Local Analysis and Prediction System, running over a Colorado 500 meter resolution domain. The analysis uses geostationary satellite (including IR and 500m resolution visible imagery, updated every 5 minutes), METARs, radar, aircraft, PM2.5, and model first guess as input data. The resulting 3-D fields include hydrometeor mass concentration (cloud liquid, cloud ice, rain, snow), along with aerosol extinction coefficient (AEC). Several land surface fields are also produced. The 500m grid resolution takes advantage of the 500m satellite resolution in the visible wavelengths. The gridded fields are converted using a ray-tracing technique into an all-sky image as detailed in this journal article [1].
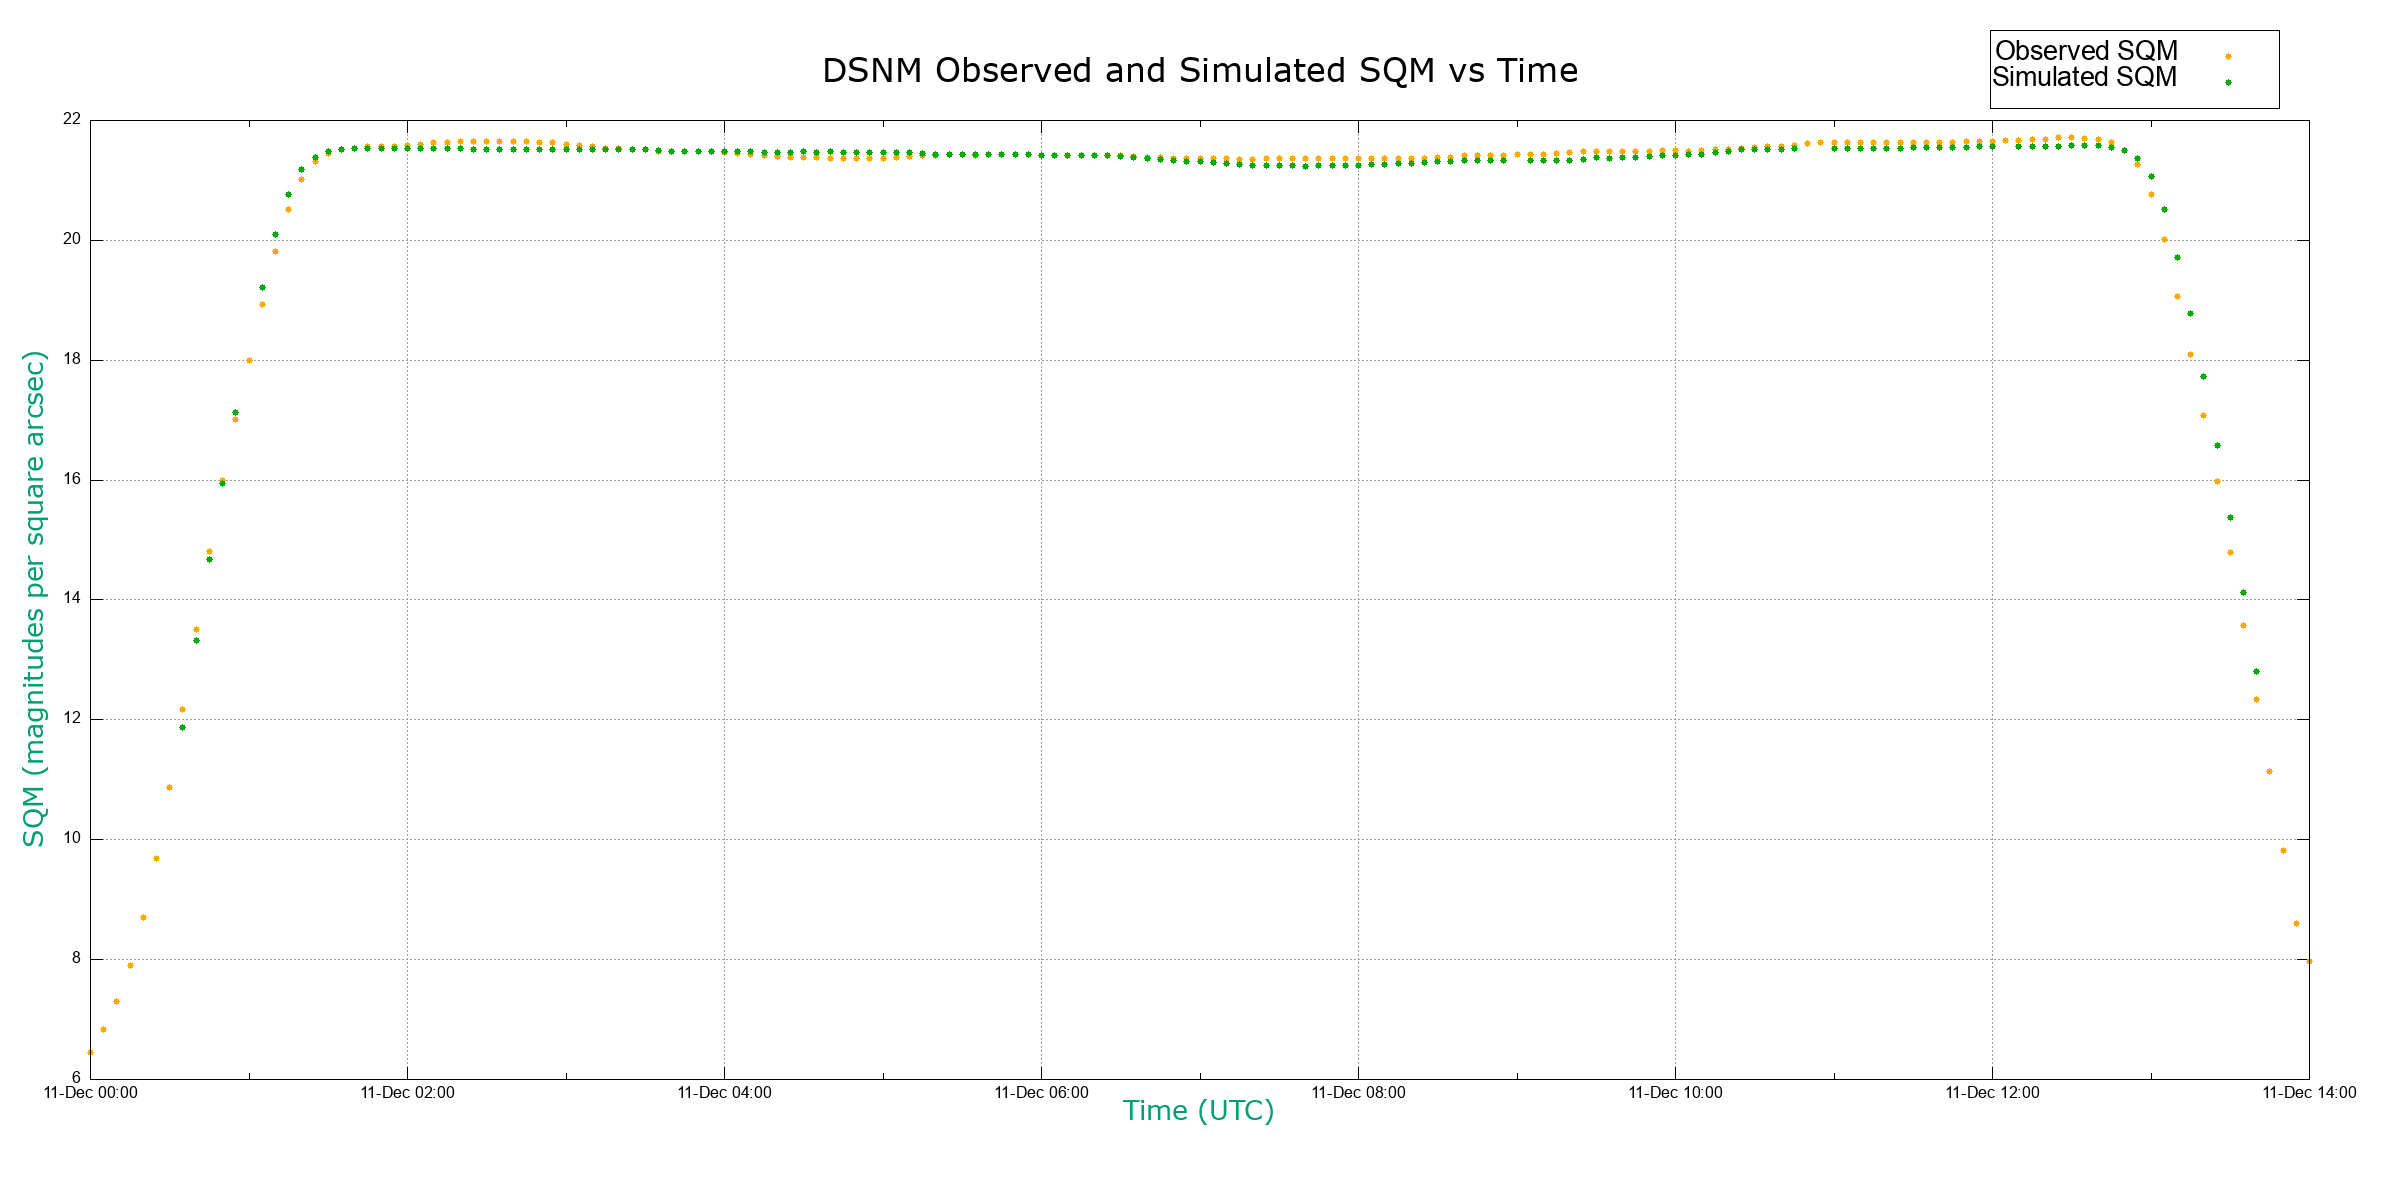
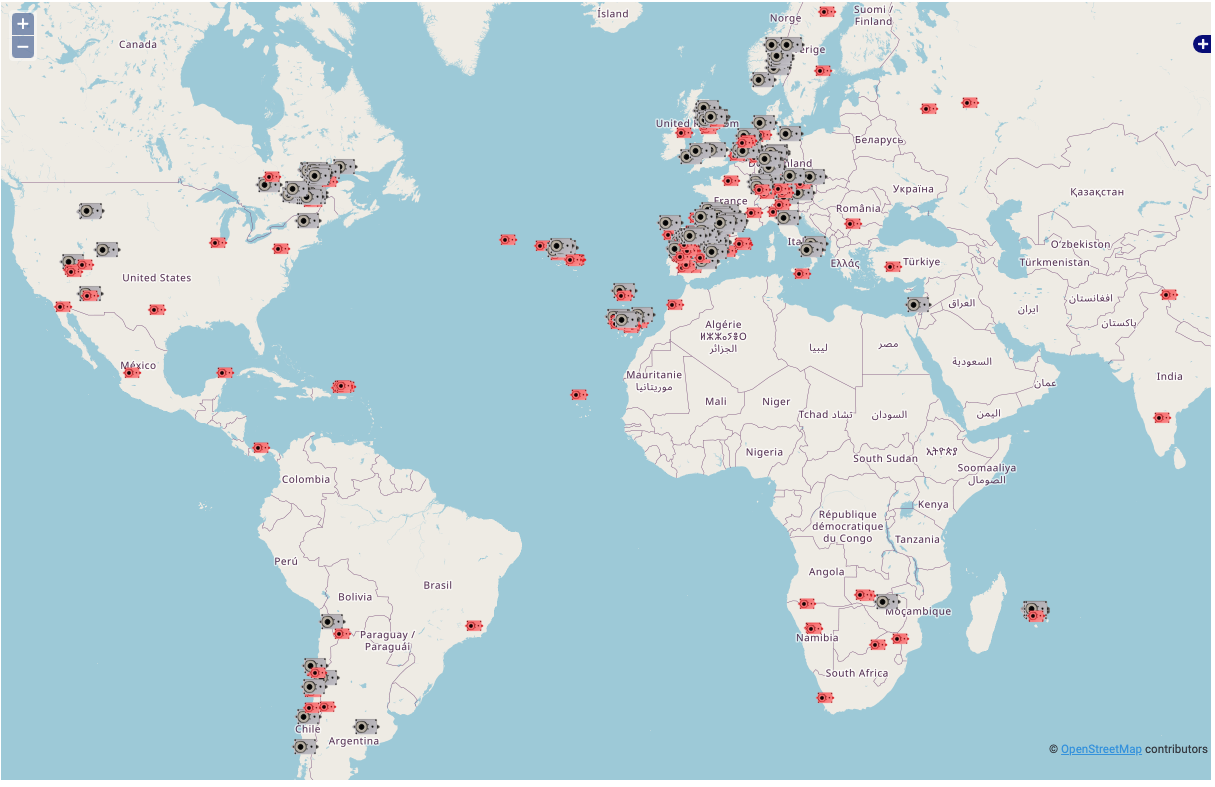
This plot shows SQM values derived from simulated sky images compared with SQM measurements on a clear moonless night at Dark Sky New Mexico. Comparisons of both SQM and IR brightness temperature are planned with a TESS instrument at Solar Hills Observatory near Montrose Colorado. Here is a map of the global network of TESS stations.